

The Work Table
The Work Table is the plan of work, written down before the run as a list of items with sizes, dependencies and releases. It is the one element the Software lens adds that is genuinely new, not a renamed version of something else.
Opening it
Section titled “Opening it”The Work Table tile does not drop a shape on the canvas. It opens a window titled Work Table. The window has no OK and no Cancel: every keystroke is already in the model. Close it with the close button or the Escape key, and one press of Ctrl+Z undoes an edit.
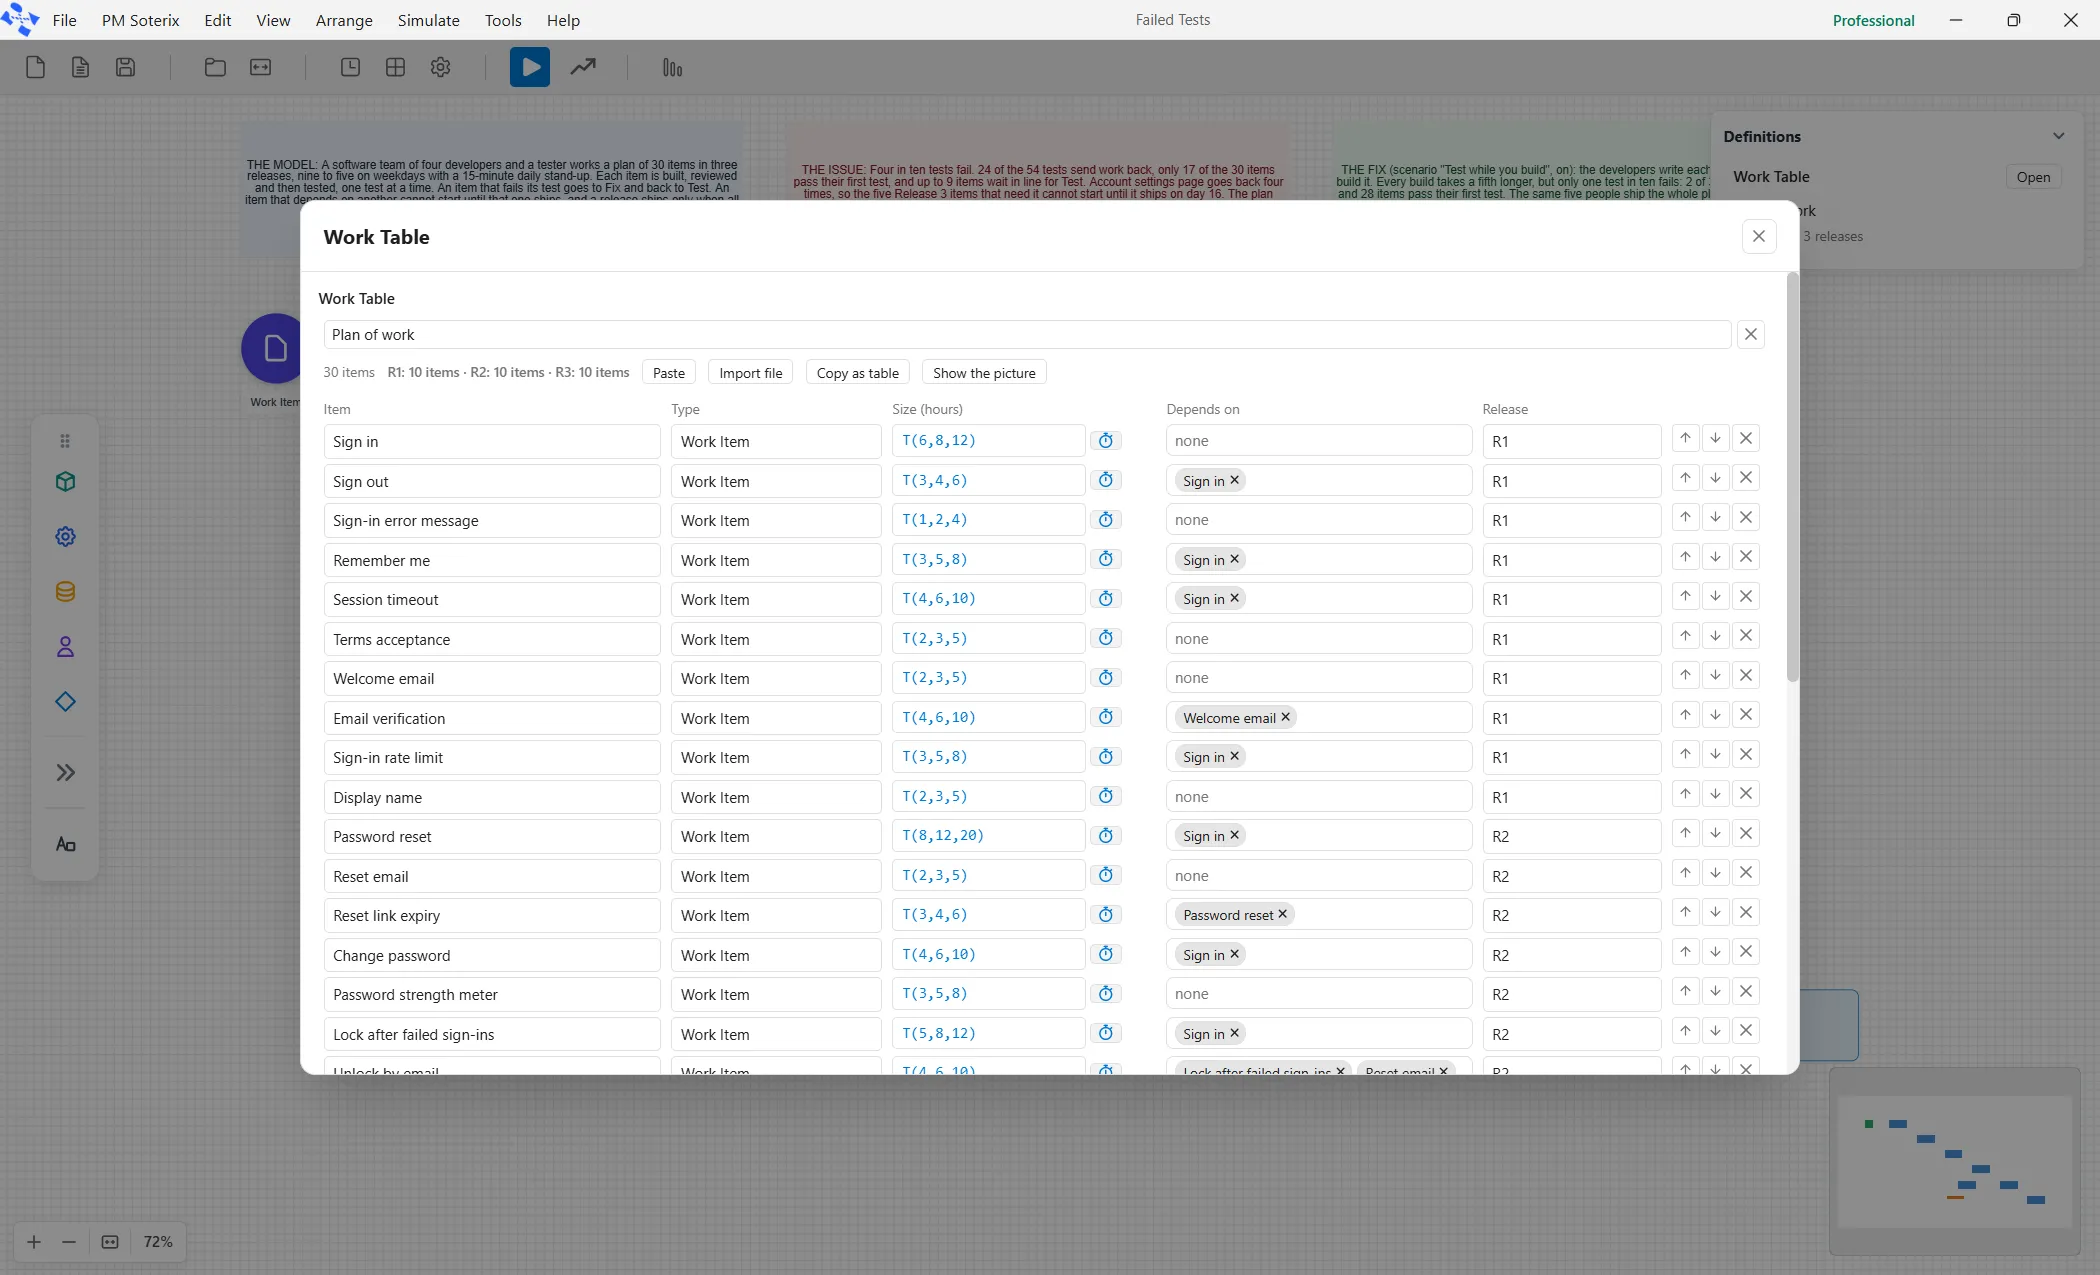
At the top is a name box for the plan, the name every arrival lists it under. Under it a strip shows the item count and how many items each release holds, with four buttons. Paste reads a plan from a spreadsheet and Import file reads one from a CSV or Excel file, and each shows the plan in a preview before it lands: the preview ends in Add N rows, which appends them after the rows you already have. Copy as table puts the plan on the clipboard, ready to paste into a sheet. Show the picture draws what each item waits for, and then reads Hide the picture.
The row Start a Software Development model on the Software face opens the Failed Tests demo, whose plan has 30 rows in releases R1 to R3.
The columns
Section titled “The columns”Each row is one work item, across five columns.
- Item, the name of the item.
- Type, which must match a work item element on the canvas letter for letter.
- Size (hours), the effort as a spread.
- Depends on, typed: as you type, matching rows are offered by number and name, and a name that matches no row stays, in the warning color.
- Release, the release the item ships in.
The last row of the grid is faint: type in it and it becomes a new row. Add Row, under it, adds a blank one. When the table has rows and the model has no Backlog, a line under the grid says so, with an Add a Backlog button that adds one activity named Backlog, with a capacity of 1 and no logic of its own.
Bringing in a plan from a sheet
Section titled “Bringing in a plan from a sheet”Paste and Import file show the plan in a preview before anything lands. Nothing is written until you press Add N rows, and Cancel writes nothing at all.
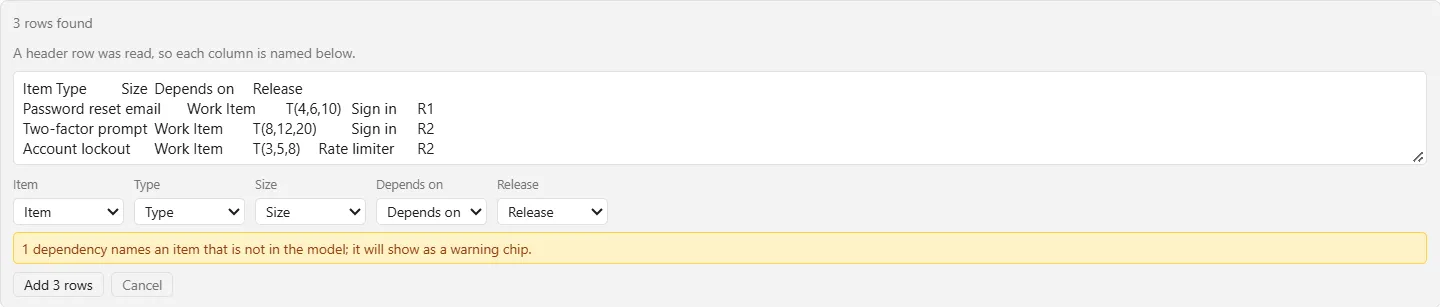
The first line counts what was found, such as “3 rows found”. The second says whether a header row was read: “A header row was read, so each column is named below.” or “No header row, so the columns are read left to right.” Under them is a list for each column of what you pasted, set to the Work Table column it matches (Item, Type, Size, Depends on or Release), or to Skip. A sheet that names its columns differently is one click from right: change the list.
When a row depends on an item that is not in the model, a note in the warning color counts them: “1 dependency names an item that is not in the model; it will show as a warning chip.” The names land as typed, in the warning color, as they do in the Depends on column.
If Paste cannot read your clipboard itself, the preview offers a box to paste into: “Paste your plan into the box below.” Esc closes the preview first, and a second Esc closes the window. One paste is one step of Undo.
The four rules
Section titled “The four rules”The window enforces four rules, and each one catches a real mistake.
Row order is priority. Use the up and down buttons on a row to move it; the team works down the list.
Depends on names other rows. An item waits in the Backlog until every row it names is Done.
Release is filled on every row or on none, and an item may not depend on something in a later release, because it would wait forever. Both are refused before the run, not during it.
Feeding it into the model
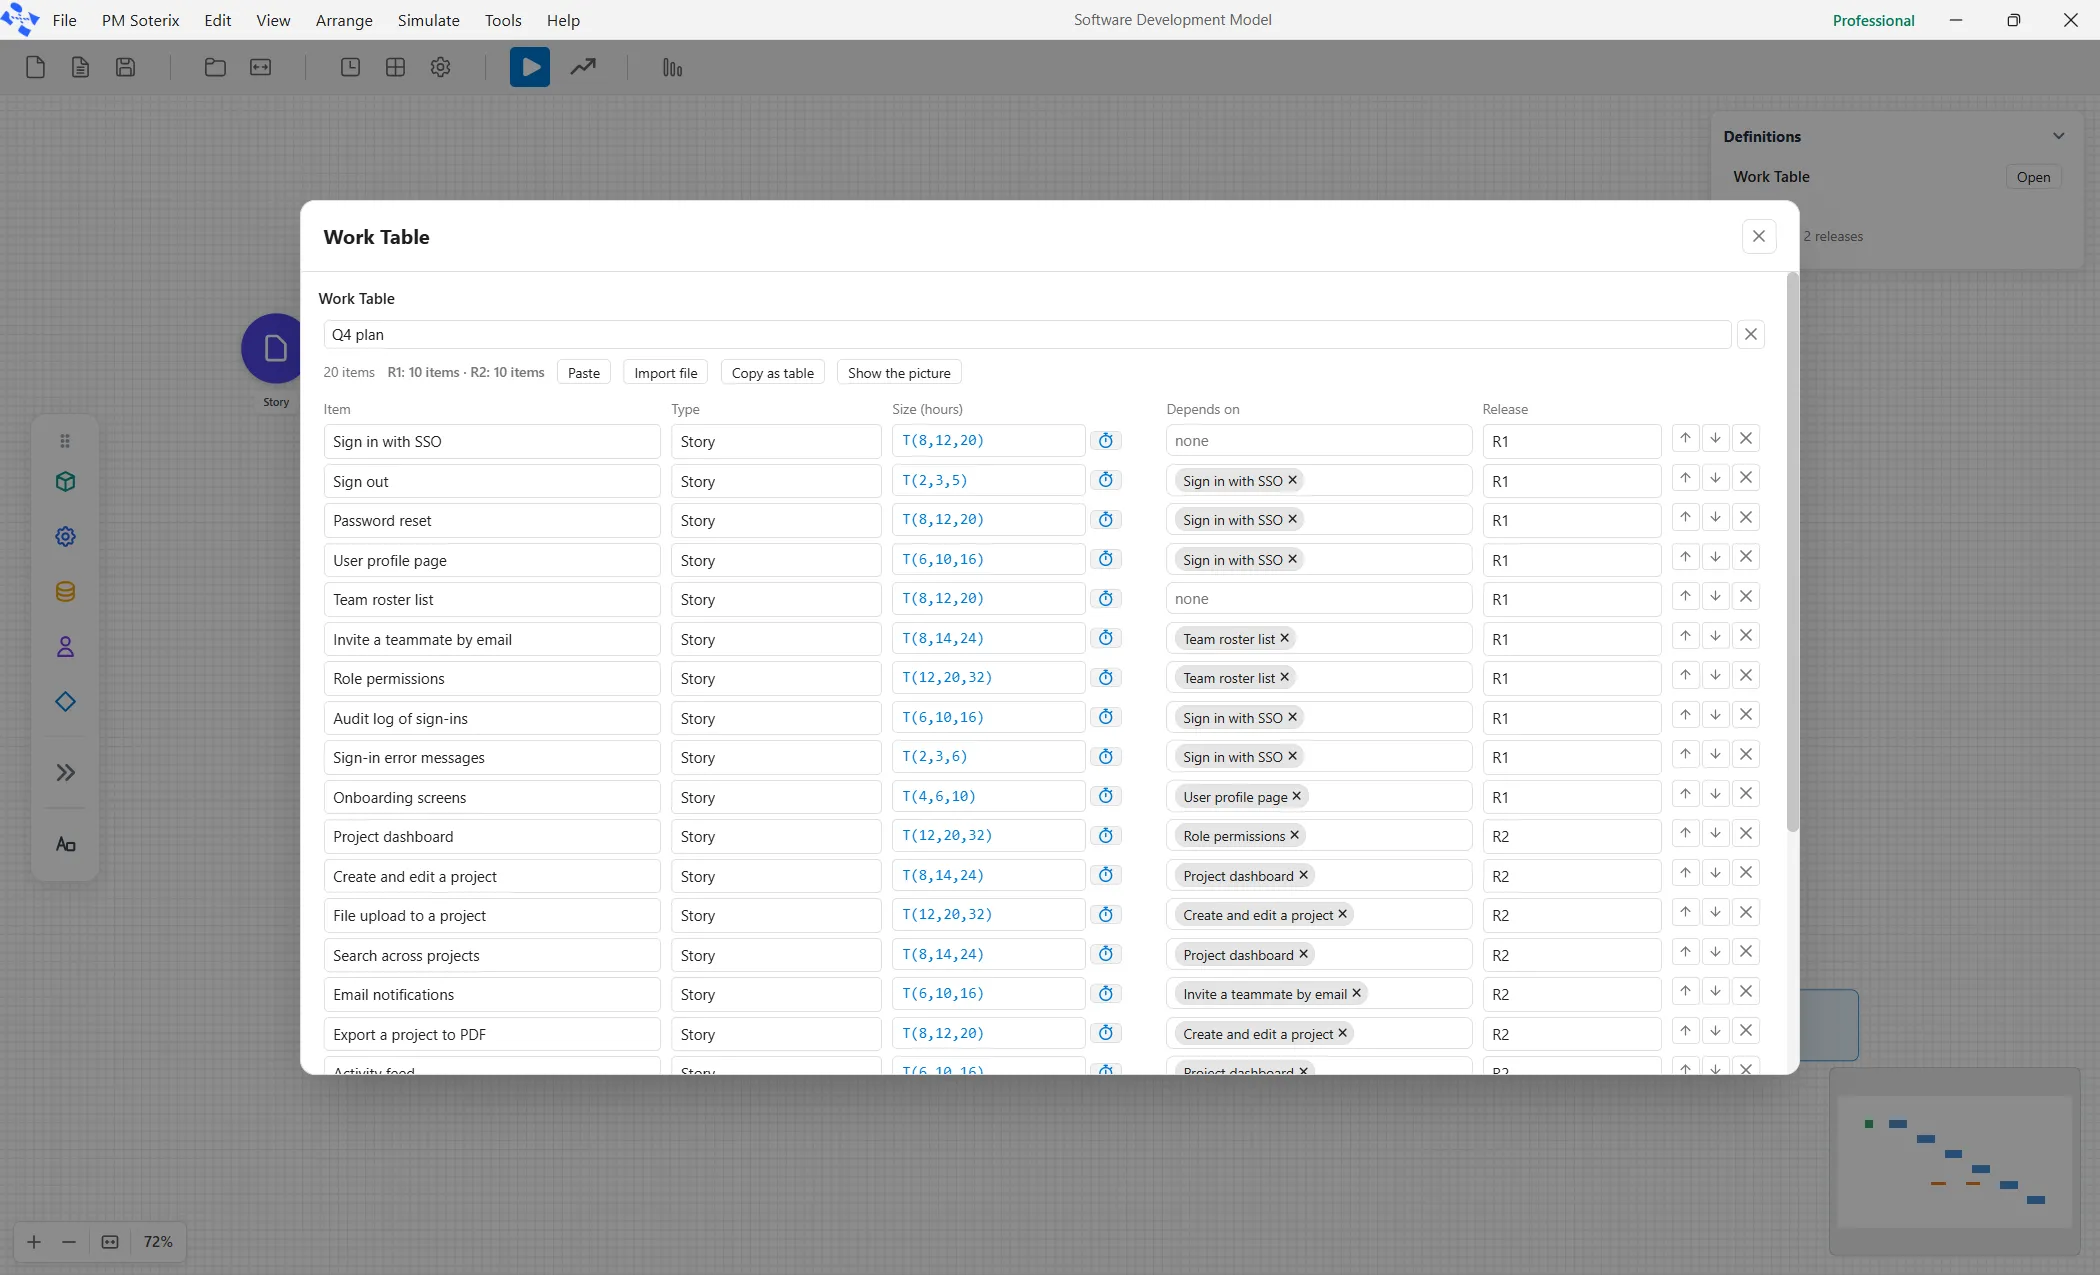
Section titled “Feeding it into the model”The plan enters the model through the arrival: an arrow from the work item element into the Backlog, whose kind is Work Table. Its Pace decides how the rows arrive. All at start puts every row into the Backlog on day one, in row order. N per sprint feeds a few rows at a time, for a team that plans sprint by sprint.
When the plan is due
Section titled “When the plan is due”A plan has a due day. Set it as the Plan date in Simulate ▸ Options, in the Run group, which shows it only under the Software view. It is a day counted from the start of the run. Beside it is Working day, how many hours a person works in a day, so effort in hours reads back as days. See Simulation options.
After a run, the Forecast tab of the report says how often the plan finished by that day: “Done by the plan day (day N): X% of runs.” With no Plan date set it says “No plan day is set, so there is nothing to be done by.” Each release gets a line of its own with its item count and, when a plan date is set, the share of runs that finished it by the plan day. See The software delivery report.