

The Simulation Window
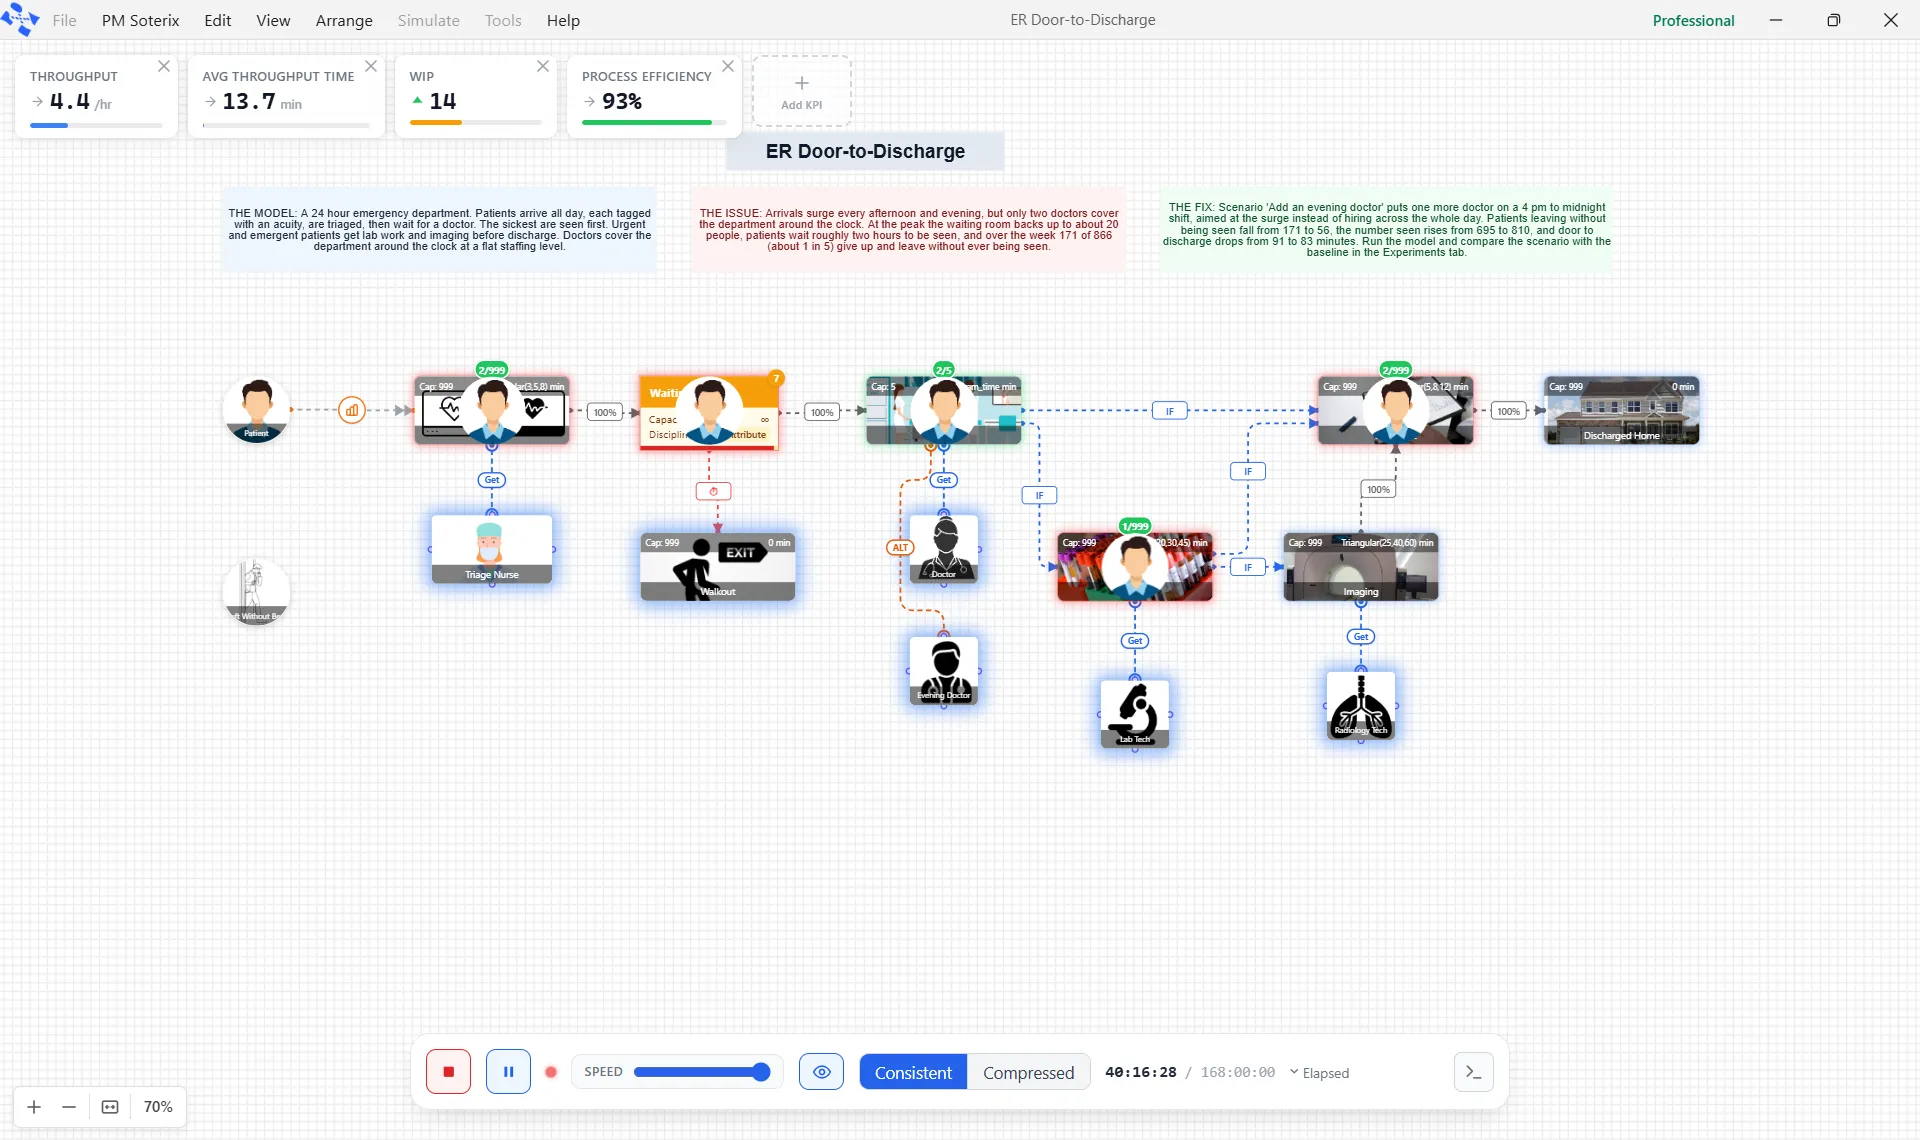
When you run a model, it comes to life on the canvas: entities move along the routes, resources light up as they work, and live cards at the top left track the results so far.
The run controls
Section titled “The run controls”A control bar sits at the bottom of the canvas while the model runs. From it you can:
- Stop the run, or pause and resume it with one button or the Space bar. Stop a single run after its warm-up and it ends like a finish: the Simulation Complete question appears with the results to that point, and the report’s banner says “Stopped early”. See Run-Time Controls for the other cases.
- Set the animation speed over 19 steps, from 1x to 1000x. At 1x the clock moves one simulated minute each second.
- Turn the animation off to let the model finish as fast as possible.
- Switch the clock between Elapsed, Calendar and Shift-relative time.
The live cards
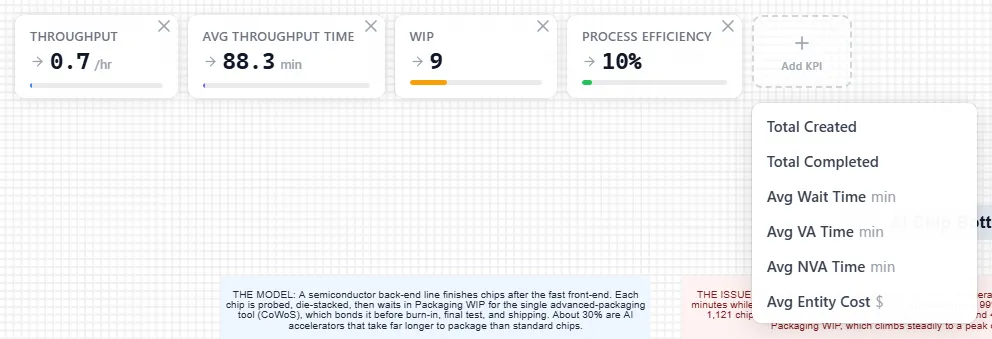
Section titled “The live cards”Once the clock starts moving, four cards sit at the top left of the canvas: Throughput, Avg Throughput Time, WIP and Process Efficiency. They read the whole model, not one entity type, and each carries a small arrow showing whether its figure is rising, falling or steady.
Take a card off with the small x in its corner (Remove KPI), and use Add KPI to bring one back or to add another: Total Created, Total Completed, Avg Wait Time, Avg VA Time, Avg NVA Time or Avg Entity Cost. The last four show a dash while the run goes, and no card shows a cost per unit. The Output Report has that detail when the run finishes. The cards you choose are saved with the model.
When the run ends
Section titled “When the run ends”When a run reaches the end of its length, the Simulation Complete question opens over the model. It says how many entities were processed and asks “Would you like to view the results?” With several replications the number is the mean for one run, and with scenarios the question lists one line for each. If the count could not be read, it says “The run finished. Its counts are in the report.”
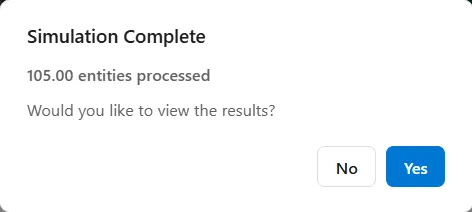
Yes closes the run and opens the Output Report. No closes the run and returns you to the model without opening the report. Either way the results are kept: open them later from Tools ▸ Output Report (Ctrl+Shift+R) or the report button on the toolbar.
Stop can end a run the same way. Run-Time Controls says when it does, and what the report says when it has.
LegacyHow this worked in the previous version
From the Simulation menu, select Simulate Chart (or Run Scenarios) to run a ProcessModel flowchart. When you run the simulation, the Simulation Window appears and ProcessModel compiles the model into simulation code for execution. Your model then starts running according to the options you have selected.
The simulation window is set to run maximized and does not allow switching to other programs running on your system. The simulation window can either be minimized or re-sized. As long as it is not running maximized, you will be able to switch between it and other programs currently running. There is no method of programmatically changing the size or priority of the simulation window. It must be changed manually. However, the status and location of the window will be saved when you end the simulation. So the next time you run a simulation, it will use the same window settings it used previously.
What is in the Scoreboard of the simulation window?
Section titled “What is in the Scoreboard of the simulation window?”In addition to your flowchart, a scoreboard appears on the Simulation Window to illustrate performance measures if the scoreboard option is selected in the Options dialog.
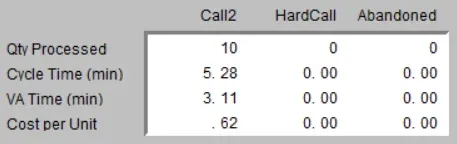
Entity1, Entity2,… Entities for which statistics are gathered are displayed across the top of the scoreboard.
Qty Processed The number of entities of this particular type that have been processed, meaning those that have exited the system.
Avg. Cycle Time (time unit) The average time the entity type spent in the system. Expressed in terms of the time unit selected in the Simulation/Options dialog.
Avg. VA Time (time unit) The average value added time, the time the entity type spent in activity time. Expressed in terms of the time unit selected in the Simulation/Options dialog.
Cost per Unit The average cost of the entity type.
- Since entity names can be changed during a simulation, statistics are collected based on the name assigned to the entity when it exits the system.
- Variables may also be shown on the Scoreboard (see variables).
- The decimal places shown in the simulation when displaying a real variable using a Label is fixed at 2 decimal places and can not be changed.