Identifying Number of Resources Needed
LegacyHow this worked in the previous version
The output report provides an average utilization with the length of the simulation. That may not present the information you need to make a staffing decision.
Action Logic
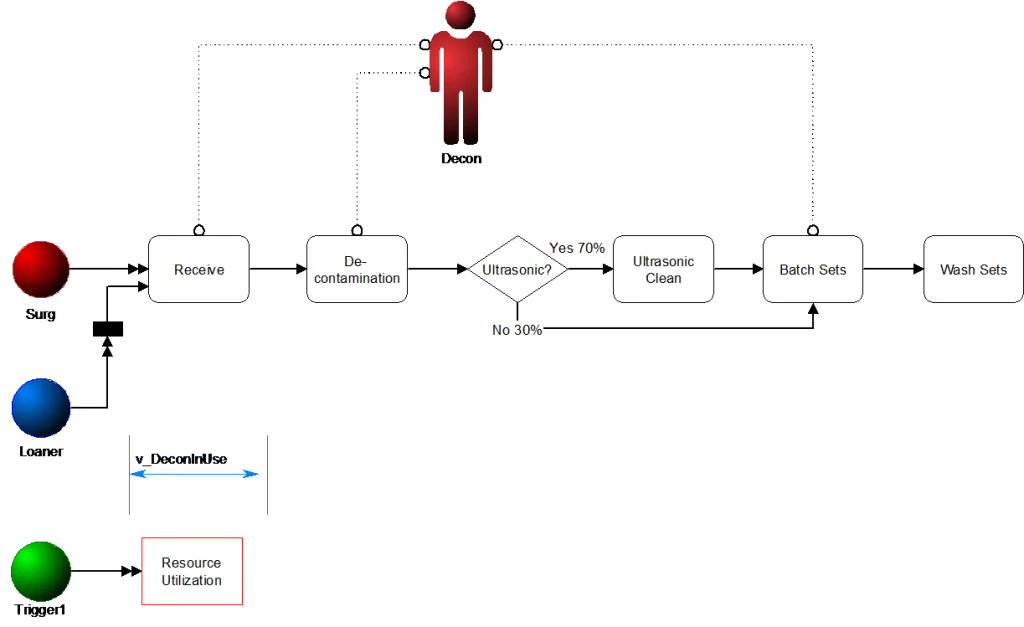
Section titled “Action Logic”Logic will go into the capacity of the ‘Resource Utilization’ activity.
V2hpbGUgMSA9IDEgRE8KCXsKCXZfRGVjb25JblVzZSA9IDEwIOKAkyBGUkVFVU5JVFMoRGVjb24pCglUaW1lIDUgU2VjCgl9
Outputs Available
Section titled “Outputs Available”Graph (Resource States)
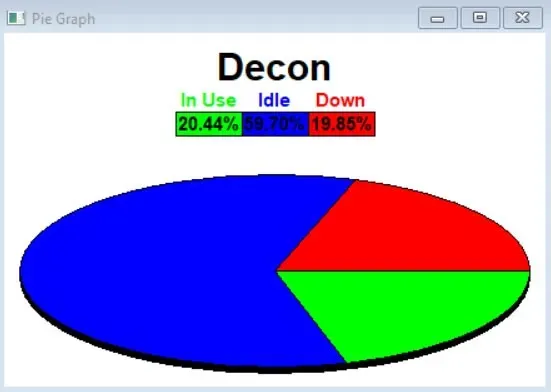
Section titled “Graph (Resource States)”- Open the Output Detailed Report.
- Click the ”View a state or utilization summary graph” button.
- Select ‘Resource States’ and click ‘OK.’
- Click on any of the bar chart line to reveal the pie chart.
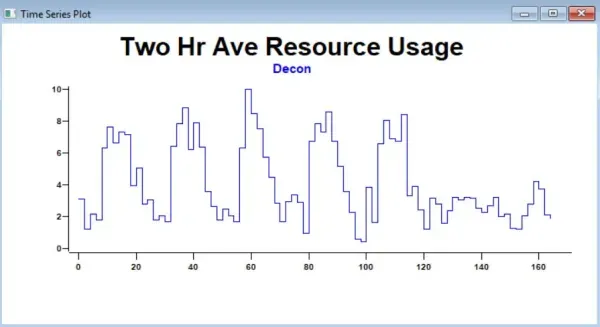
Graph (Resource Two Hour Averages)
Section titled “Graph (Resource Two Hour Averages)”-
Open the Output Detailed Report.
-
Click on the ‘Generate a time series plot’ button.
-
Add the variable to selected values and click ‘OK’
Advance Topics
Section titled “Advance Topics”-
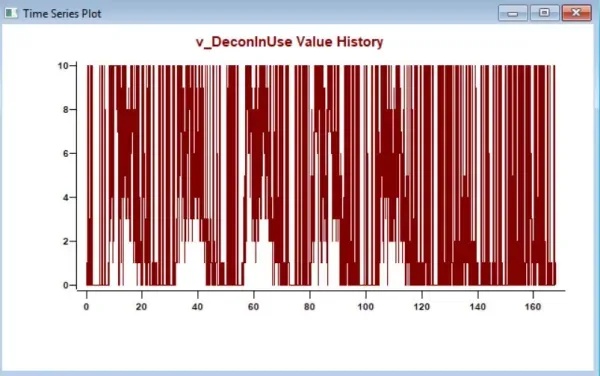
Setting the periodic unit to smooth the requirement (need of resources) Answer:
-
Open the Output Detailed Report.
-
Click on the ‘Generate a time series plot’ button.
-
Add the variable to selected values and click ‘OK.’
-
Click ‘Options Customize Current Window.’
-
Click ‘Plot Options.’
-
Change the ‘Plot Type’ to ‘Periodic Average’ and ‘Period’ to ‘2’ hours.
-
Click ‘OK.’