

The Bulk report
A fluid model’s output does not live on the report’s opening page. It lives on the Bulk tab.
Finding it
Section titled “Finding it”Levels over time
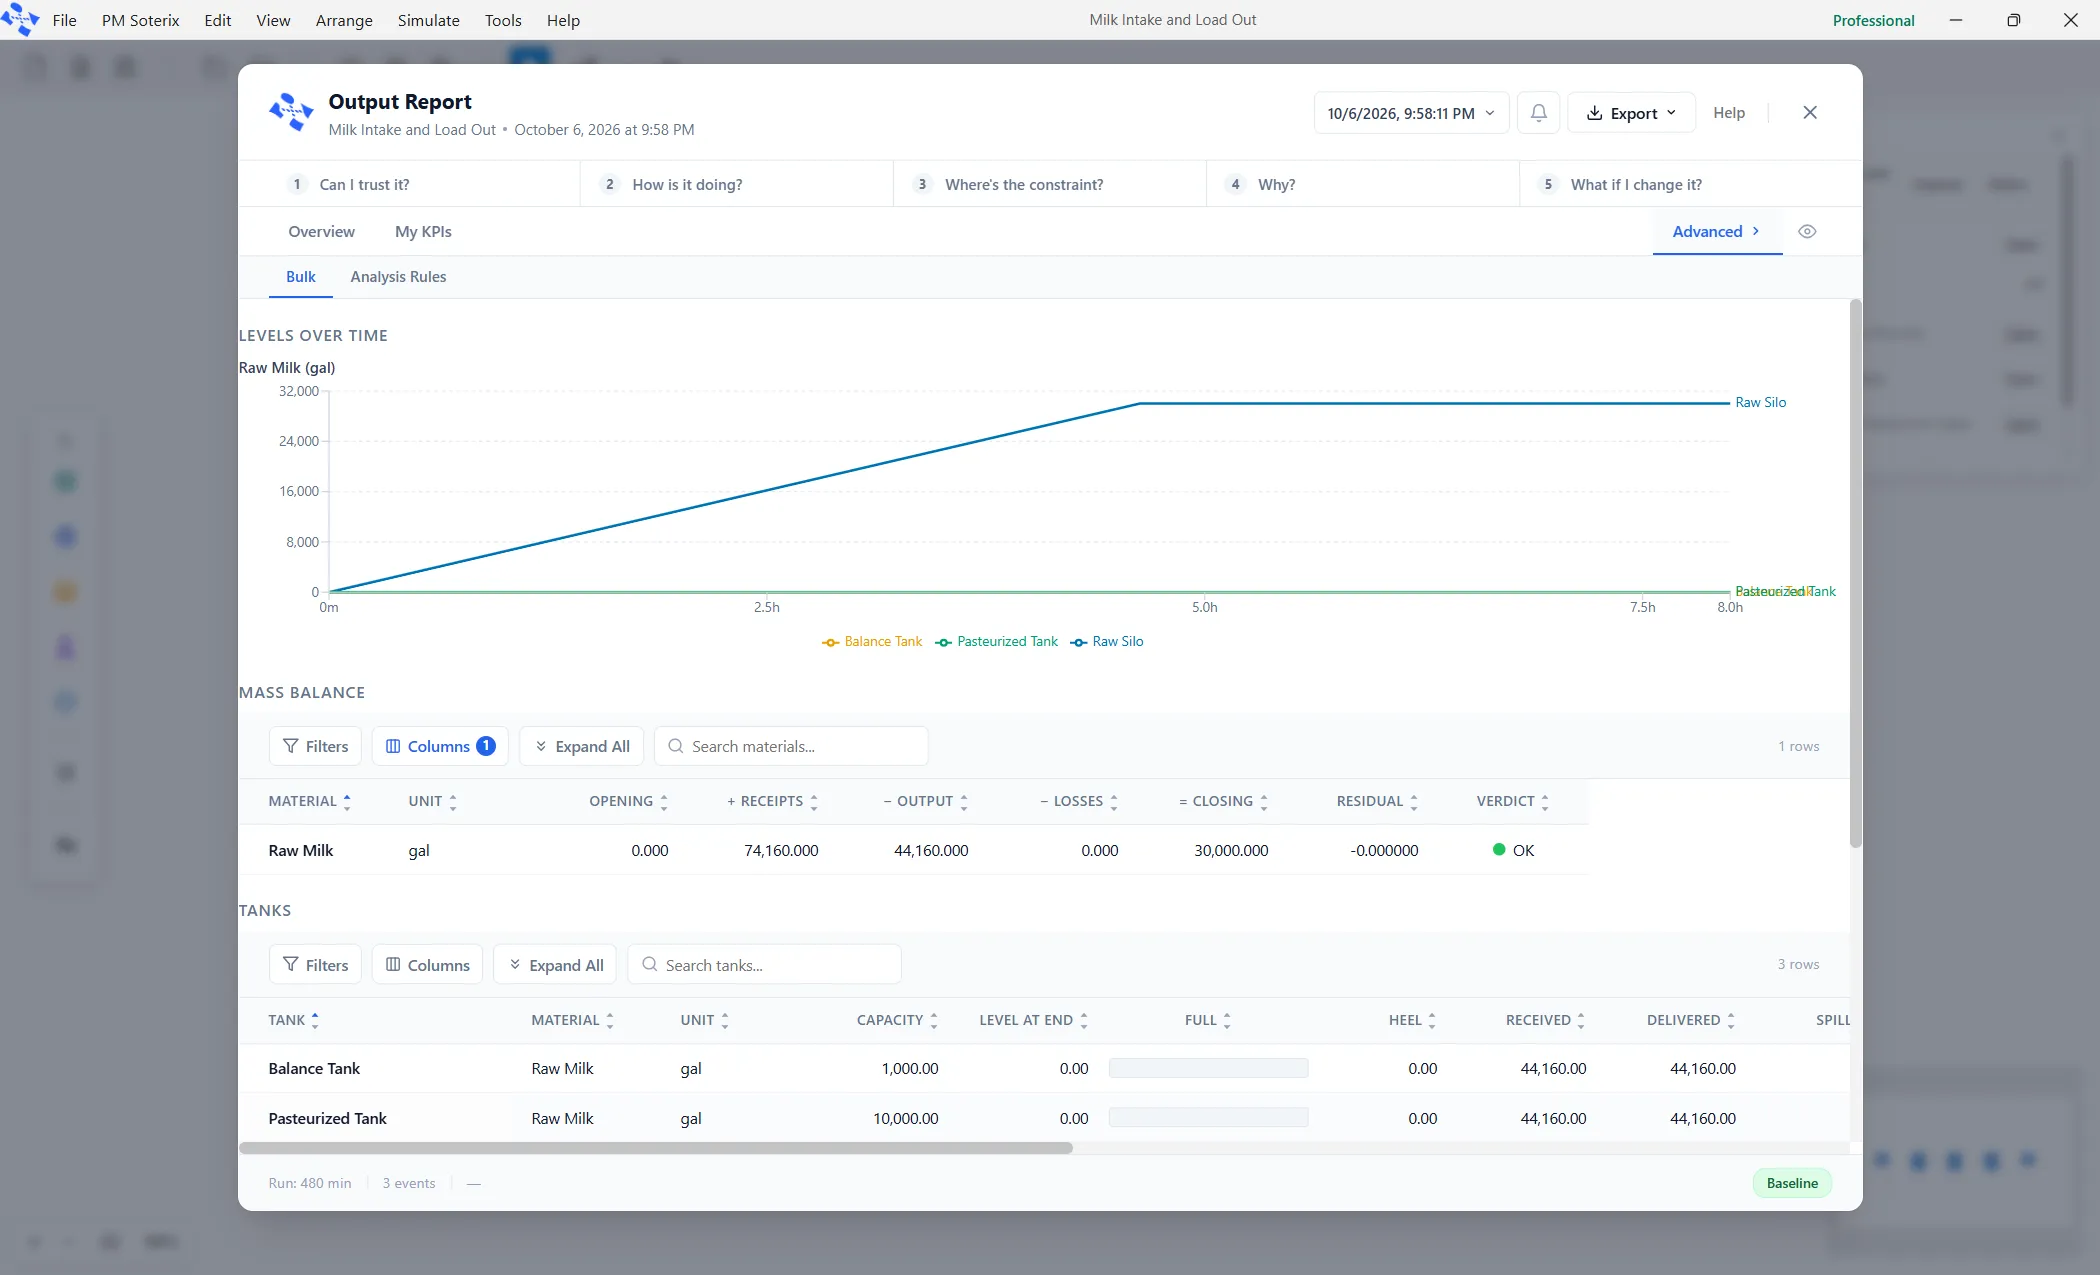
Section titled “Levels over time”The first thing on the Bulk tab is a chart of every vessel’s level through the run. A straight climb is a constant difference between what comes in and what goes out. A flat top is a vessel that filled and stopped accepting. A flat line on the bottom is a vessel that passed everything straight through without ever holding a gallon.
The mass balance
Section titled “The mass balance”Under the chart is one row per material: opening, receipts, output, losses, closing, a residual and a verdict.
The Tanks table
Section titled “The Tanks table”One row per vessel, with the columns that answer whether each is the right size: capacity, received, delivered, level at end, average level (which is time weighted), the share of the run spent full, the share spent at the heel, and turnovers, which is delivered divided by working volume. A vessel that turns over many times a shift is a buffer; one that turns over about once is storage.
The Transfer Lines table
Section titled “The Transfer Lines table”One row per pipe, and this is usually where the answer is.
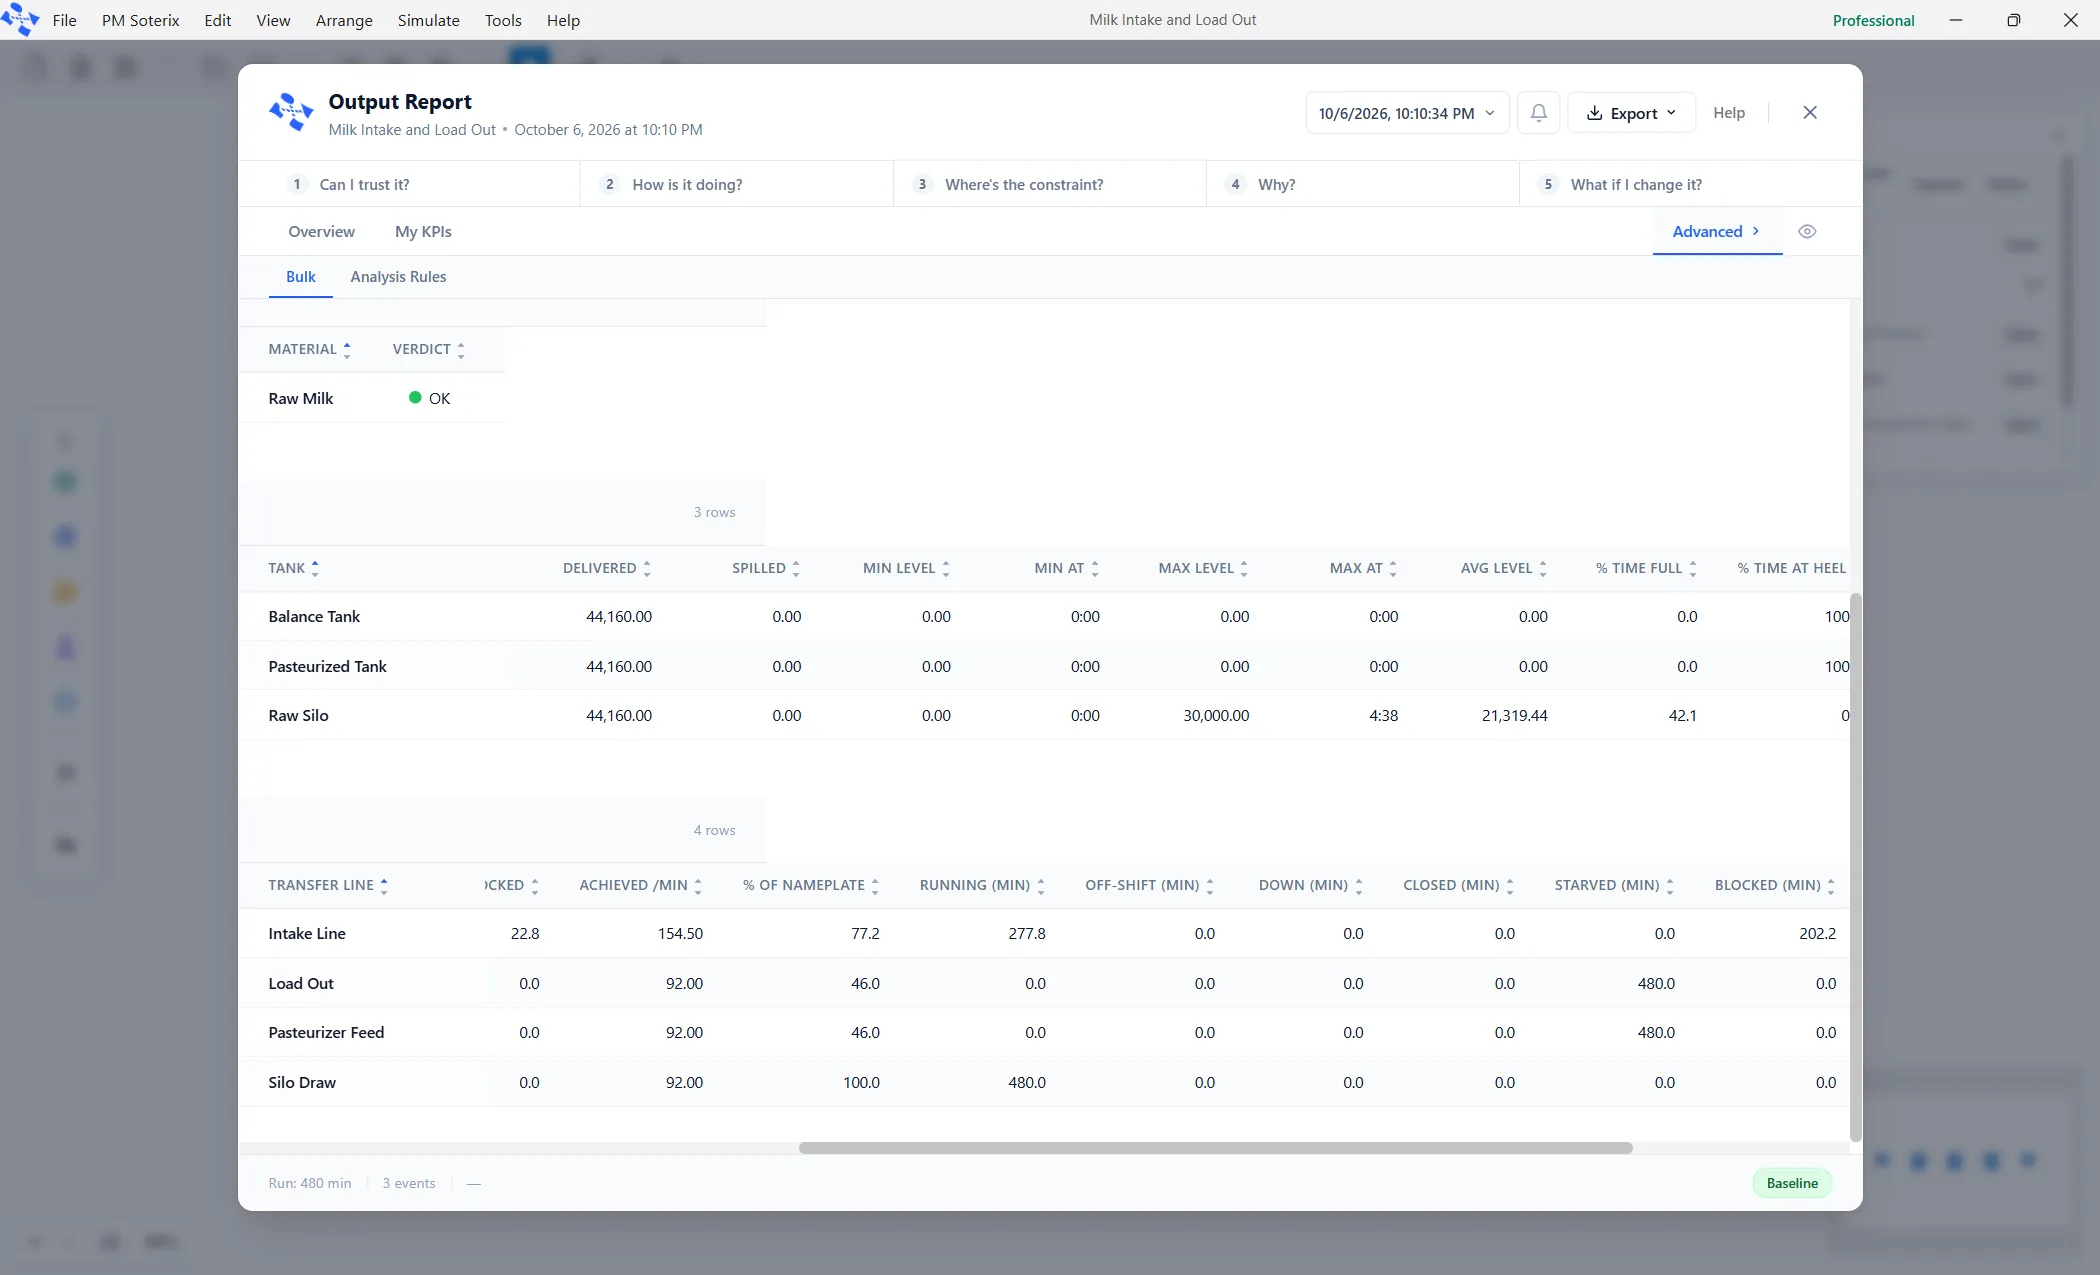
Each pipe’s time is split across six buckets that always add up to the length of the run: Running, Off-shift, Down, Closed, Starved and Blocked. Down outranks the rest, because a broken pump is broken whatever its tanks are doing. Starved is the source failing to keep the pipe fed at its rated speed; Blocked is the destination failing to take what the pipe offers.
Reading it
Section titled “Reading it”A pipe can read Starved for the whole run and still have moved a great deal. Starved means it never reached its rated speed, not that nothing moved. To find the constraint, look down the percent of nameplate column: the pipe at 100 percent while every other pipe runs below its own rating is the one that sets the pace for the whole plant.
To see which element stopped the others, open the Bottlenecks tab: on a fluid or bulk run it adds a table of who is at fault, described in Report Tabs.
The sections below Transfer Lines
Section titled “The sections below Transfer Lines”Under the Transfer Lines table, the tab carries one section for each kind of element the model uses. A section appears only when the model has something to report in it, so a plant with no skids has no Skids section.
| Section | What it shows |
|---|---|
| Unit Operations | One row for each machine: what it drew, delivered and lost, its yield, what stopped it and which tank to fix, and the same six time buckets as a pipe. |
| Skids | One row for each frame that carries machines in order: its Sections, the rate it achieved, and the Binding Section that held it back, with its Share of Run. |
| Dumpers | Dumps, Dumped, Turned Away, Un-dumpable (min) and Per Dump. |
| Discharges | Batches, Discharged, Per Batch and how often a request was Refused. |
| Clean Groups | The wash bill: Cleans, Washing (min), Per Wash, Wind-down (min), Resource Wait (min) and Cost. |
| Setup Groups | The same for changeovers, so you can tell whether the wash or the changeover costs more. |
| Fillers | Containers, Drawn, Starved %, Blocked %, changeovers, Availability, Performance, Quality, OEE and the six time buckets. |
| Containers by Format | A row for each filler and each container format it ran, with the containers finished in that format. |
| Run Table | The plan against what was made, for each run table. |
| Money | Costs and revenue, when the model prices anything. |
The Run Table section opens with a headline for each table: Planned, Made, and “Plan met” or how many rows are short. Then come the two planning lines, which begin “Milk: received” and “Tanks:”, a block for each product with its plan, what was made and packed and why it ran short, an Hours, per day table for each element that reads the plan, and one row for each row of the plan. See Run Tables.
The Money section holds By Material, what was received and sold, what it cost and earned, and the Shrink Cost of what was lost; By Element, what each element cost; Shrink by Site, where material was lost; Constraint Cost, what each hold-up cost; Totals; and How these were priced, the pricing rules behind each line.
Hover a column heading on any table to see what it measures.
The shrink the plan expects
Section titled “The shrink the plan expects”Not every figure here was measured. Expected shrink, the last row of the Definitions card, is the percent of milk you expect to lose between the receiving bay and the case: a planning figure, set in Materials and the Definitions panel. On a plan with a Run Table, the milk line that begins “Milk: received” starts from it. What was received, less the shrink, less what leaves as a by-product, is what there is to plan against. The money figures on this tab measure the real loss separately.