

The emergency department report tabs
With the lens on, the Output Report shows six tabs of the department’s own in place of the general ones: Front Door, Flow, Getting Out, Crowding, Team and Spaces and Money. They sit in one row under the Rules strip, and a tab shows only when the run holds its rows. This article takes the first five. Money has its own article, Cost per patient.
Each time table has a row for All patients and one for each acuity level (ESI 1 to ESI 5 in the pictures), the patients in the row (N) and the times P50, P85, P90 and P95. Each chart has a Show as table button.
Front Door
Section titled “Front Door”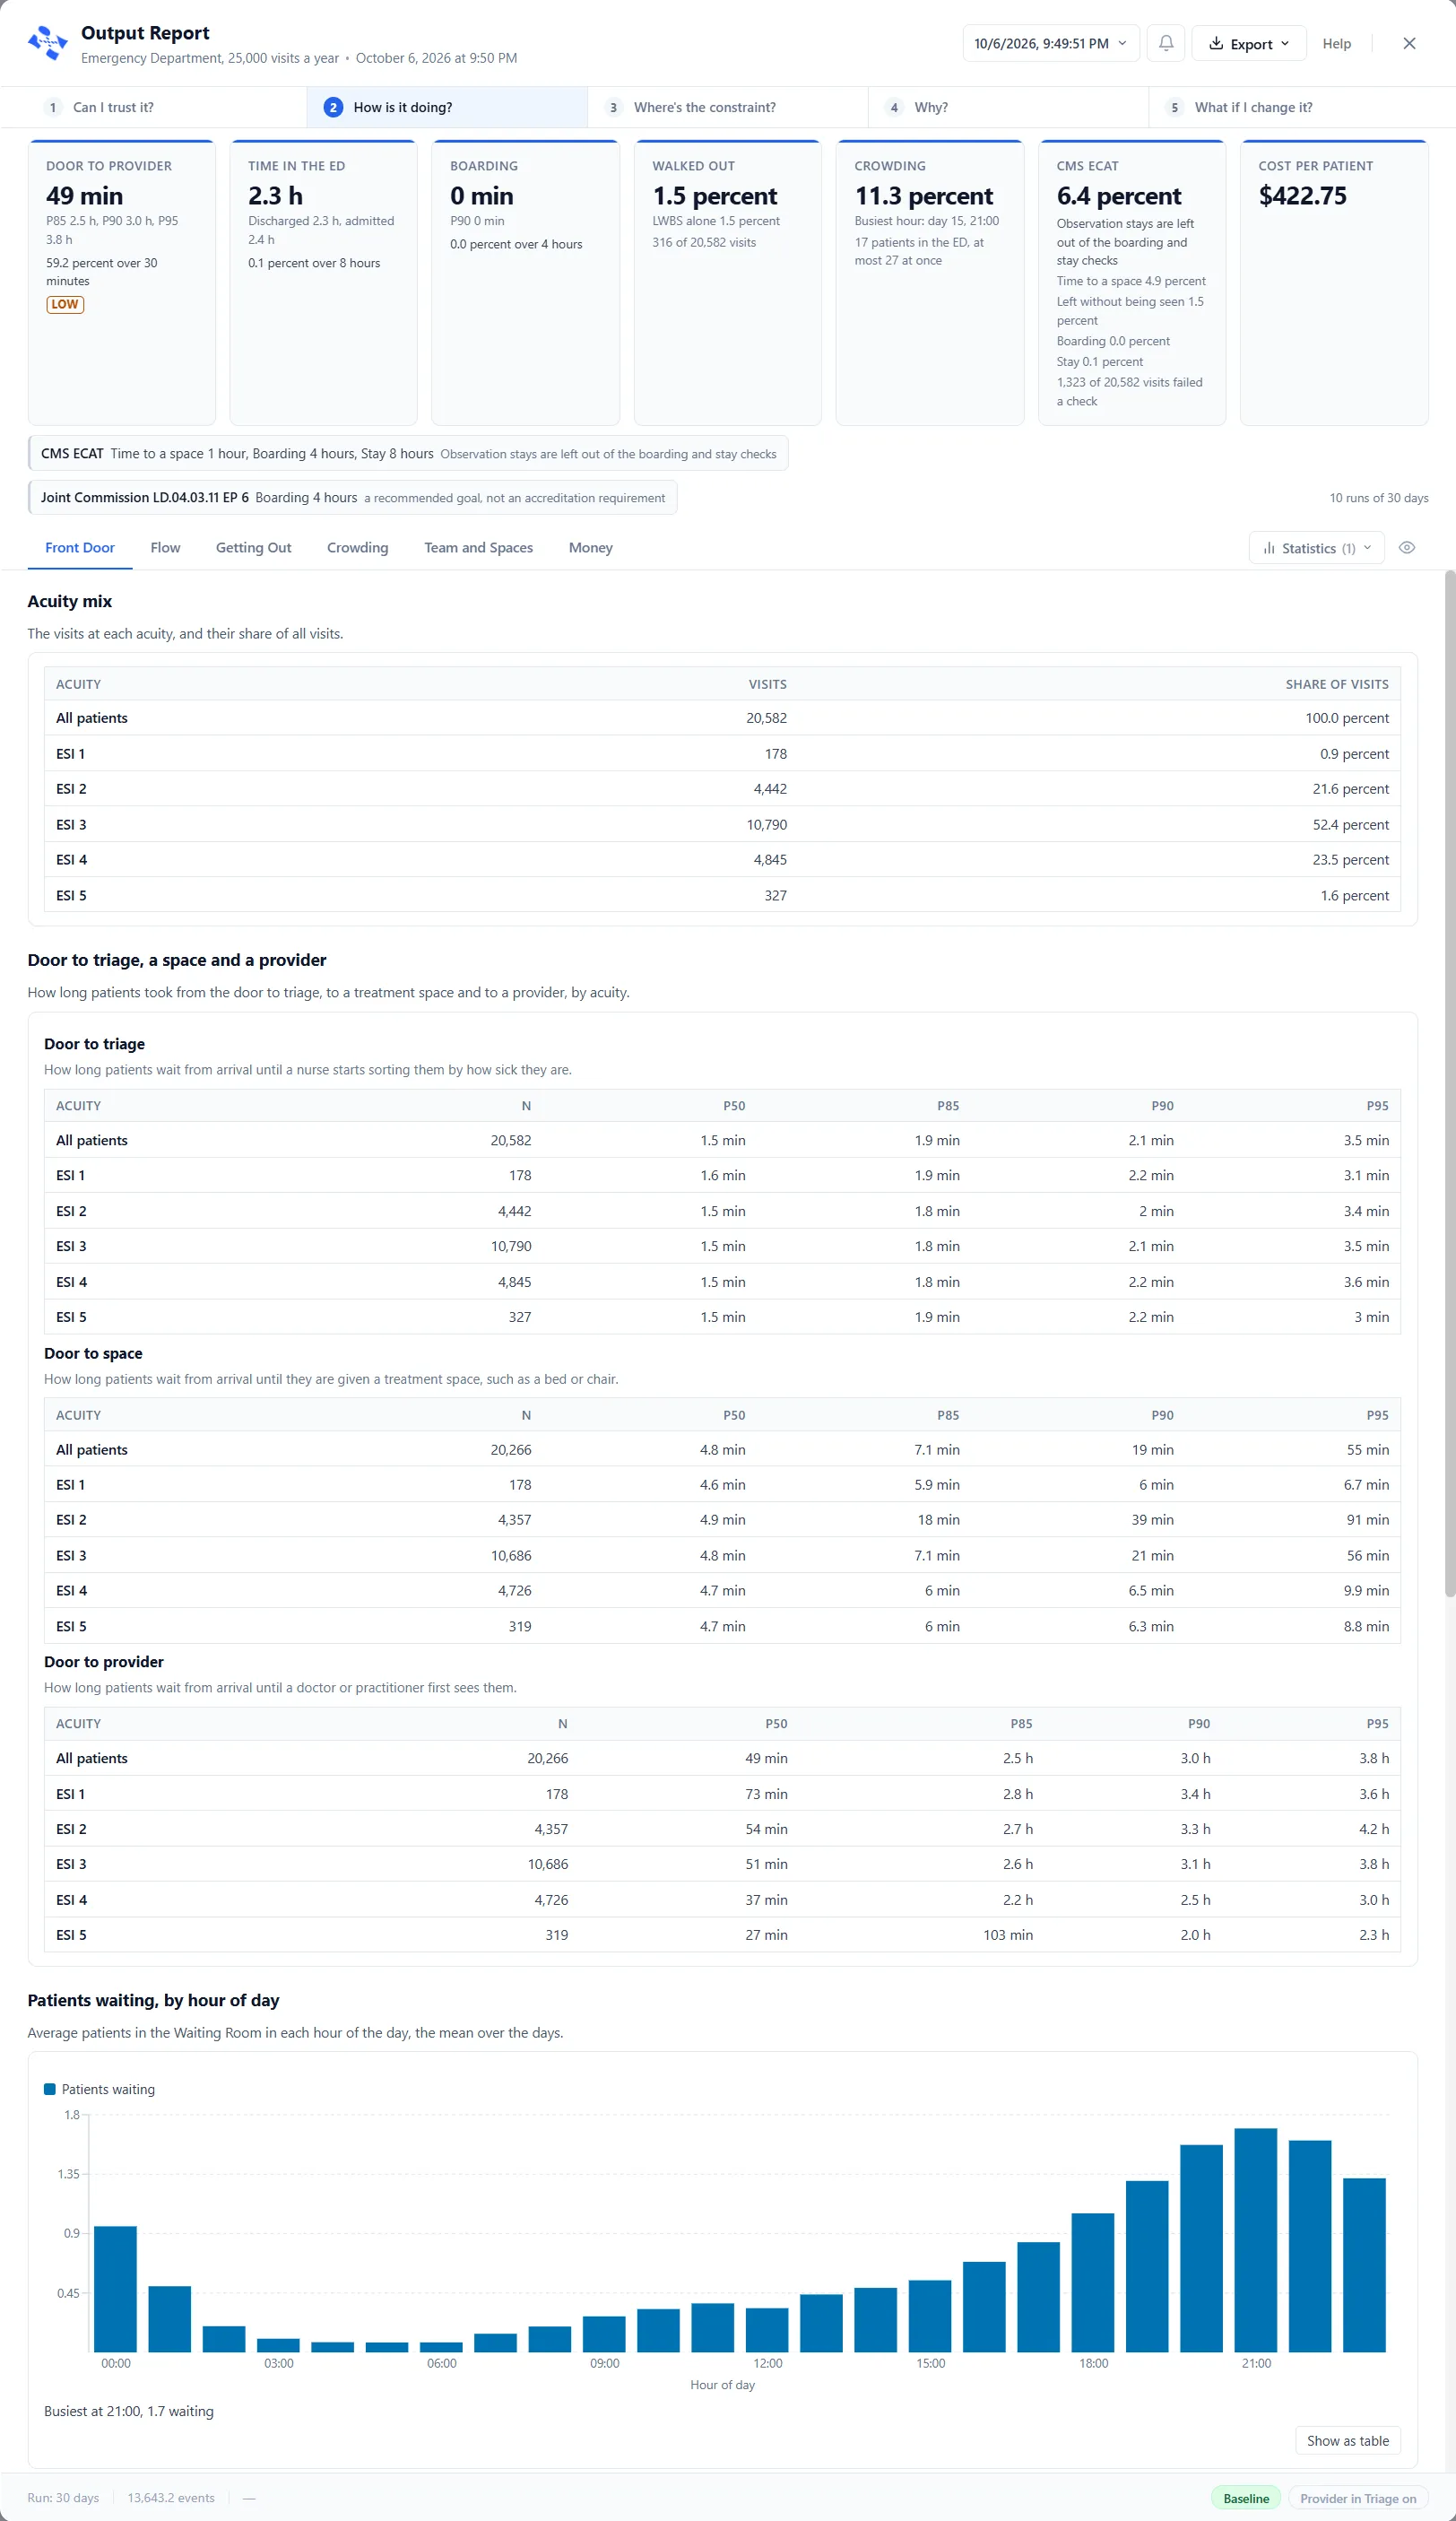
Front Door is about the wait before care begins. Acuity mix gives the visits at each acuity and their share. Door to triage, a space and a provider gives three tables by acuity: Door to triage ends when a nurse starts sorting patients by how sick they are, Door to space when they are given a treatment space, and Door to provider when a doctor or practitioner first sees them. Patients waiting, by hour of day charts the average patients in the Waiting Room in each hour.
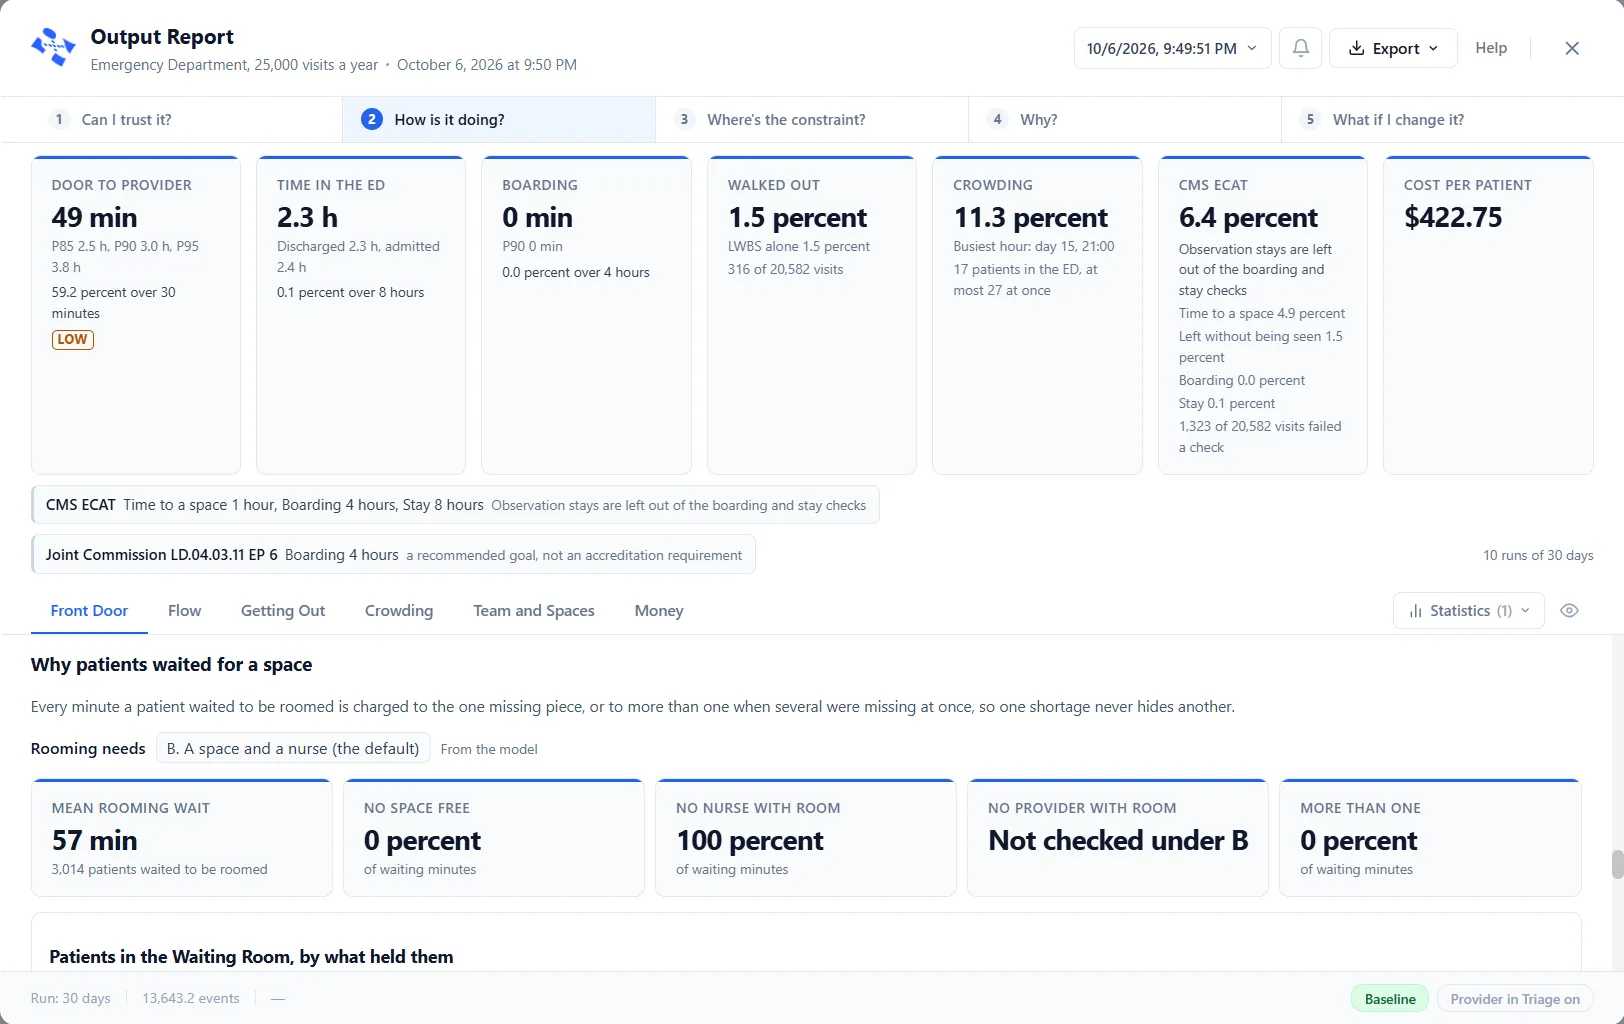
Further down, Why patients waited for a space breaks the wait down by what was missing. Every minute a patient waited to be roomed is charged to the one missing piece, or to more than one when several were missing at once, “so one shortage never hides another.” The Rooming needs line reads the choice made on the Room step, with the note From the model. The tiles give the Mean rooming wait and the share of the waiting minutes held by No space free, No nurse with room, No provider with room and More than one. A piece the choice does not check reads “Not checked under B”, with the letter of the choice. See Settings for an emergency department model.
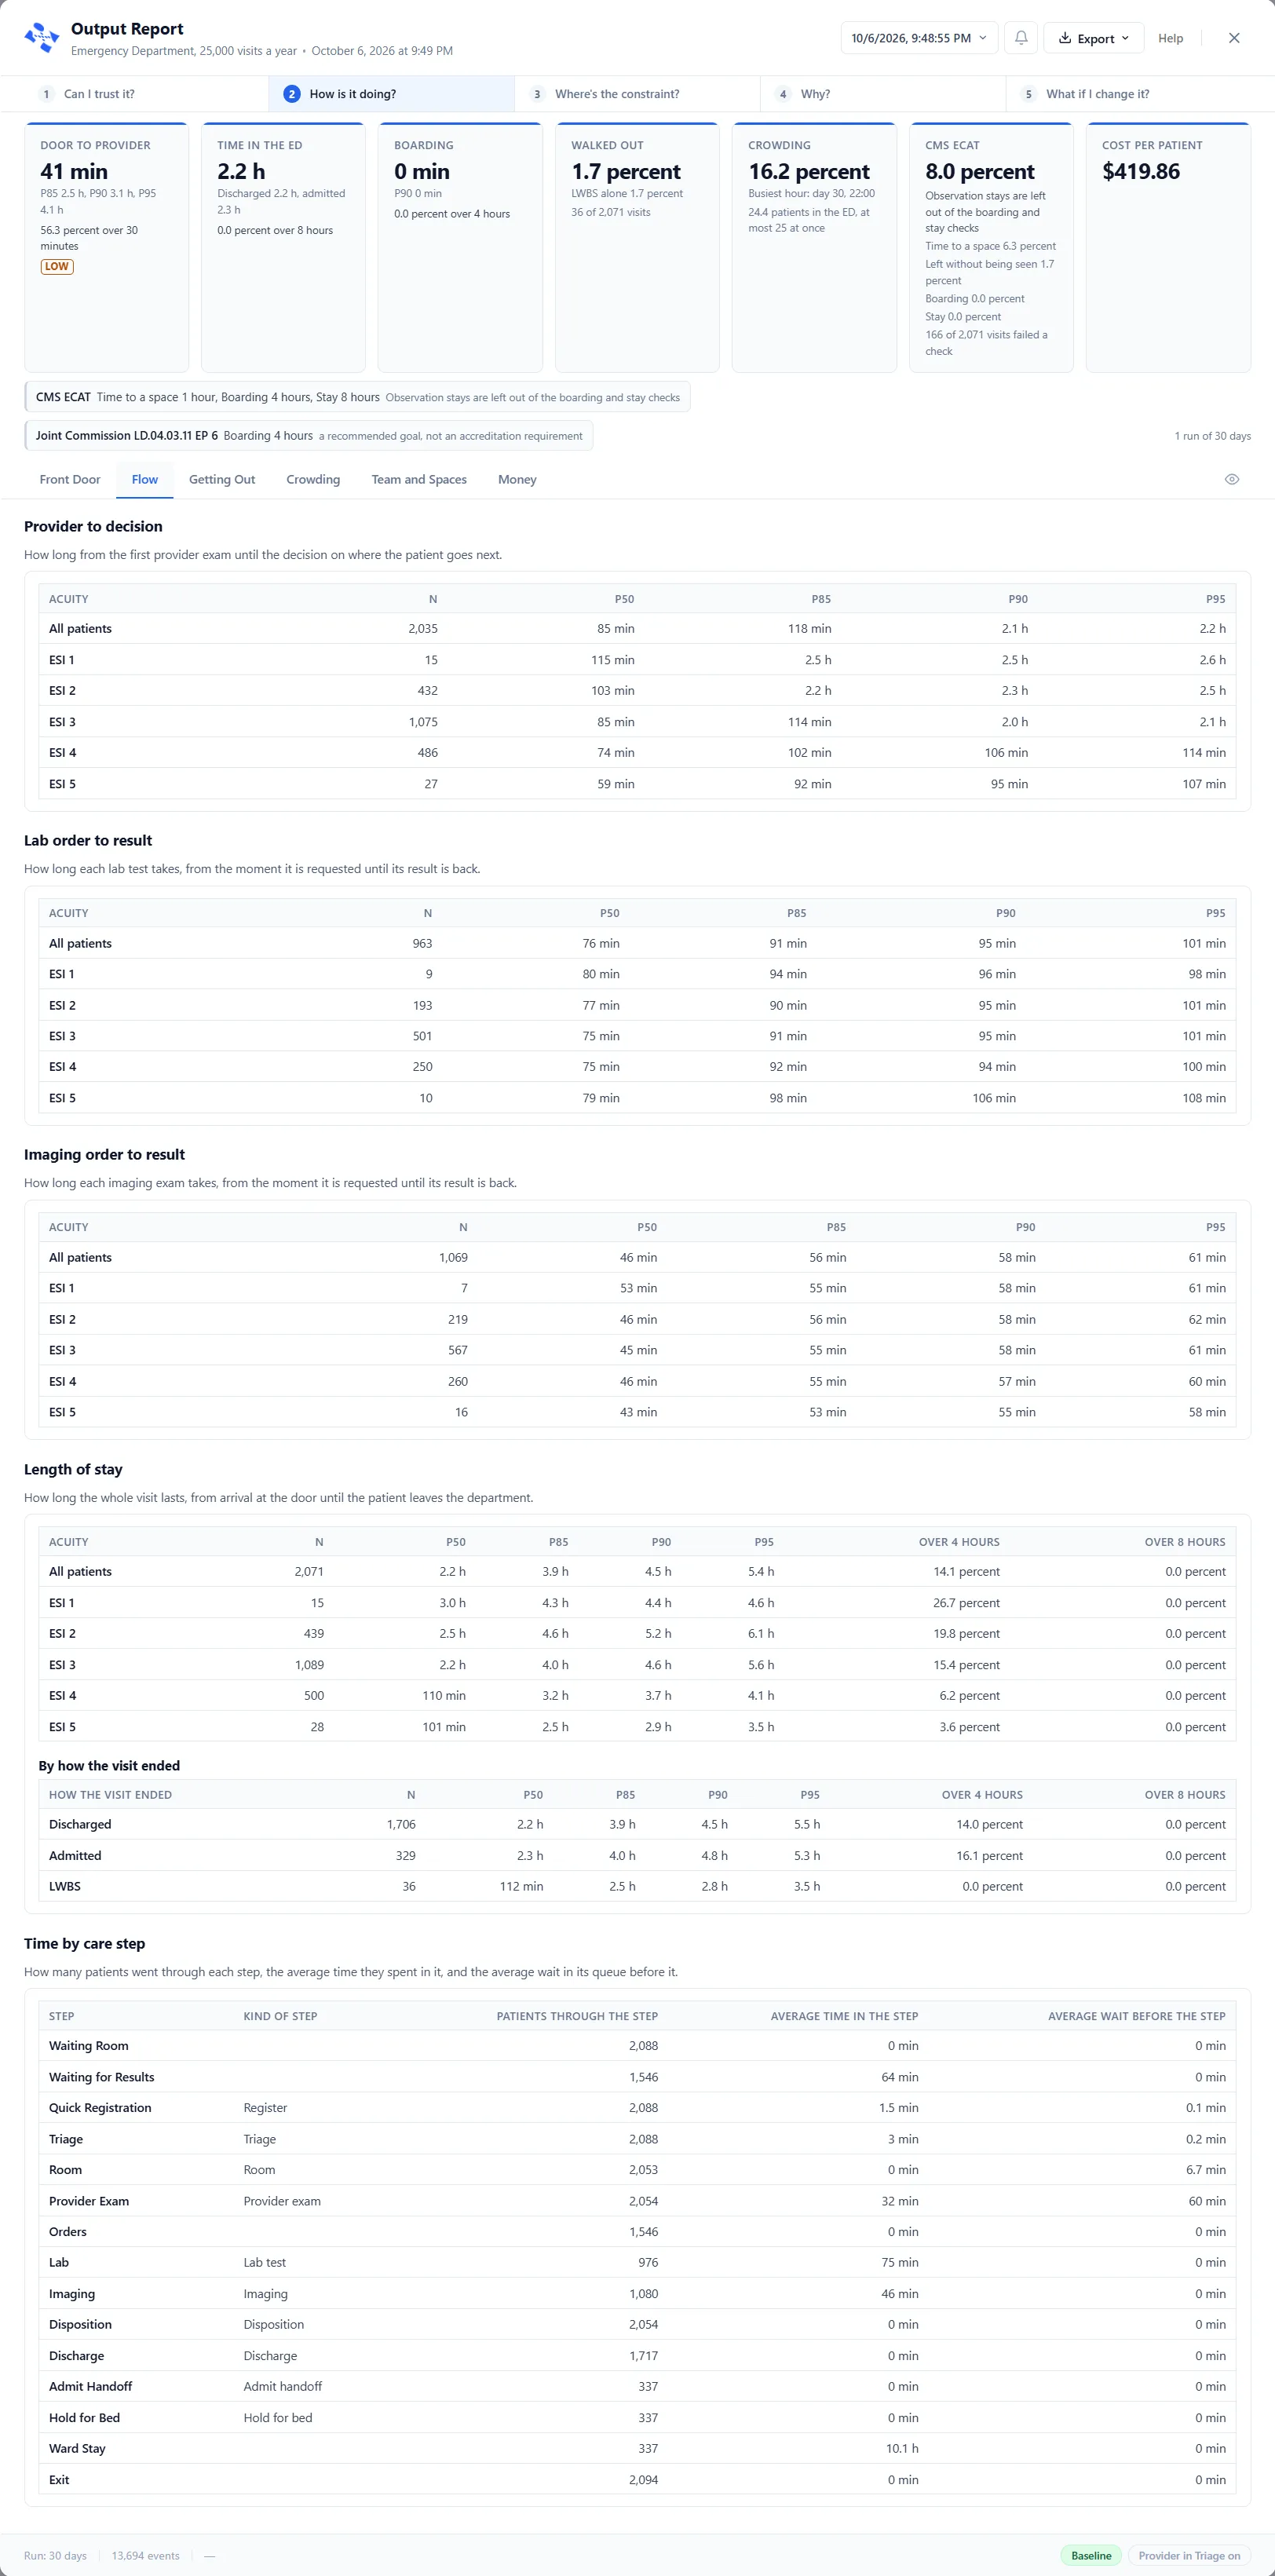
Flow times the parts of a visit once care has begun: Provider to decision, from the first provider exam to the decision on where the patient goes next; Lab order to result and Imaging order to result, from the request until the result is back; and Length of stay, from arrival at the door until the patient leaves. Length of stay adds a column for each line set under Report rules, Over 4 hours and Over 8 hours in the picture, and a second table, By how the visit ended, with a row for each way a visit ended.
Time by care step lists every step with its Kind of step, the Patients through the step, the Average time in the step and the Average wait before the step.
Getting Out
Section titled “Getting Out”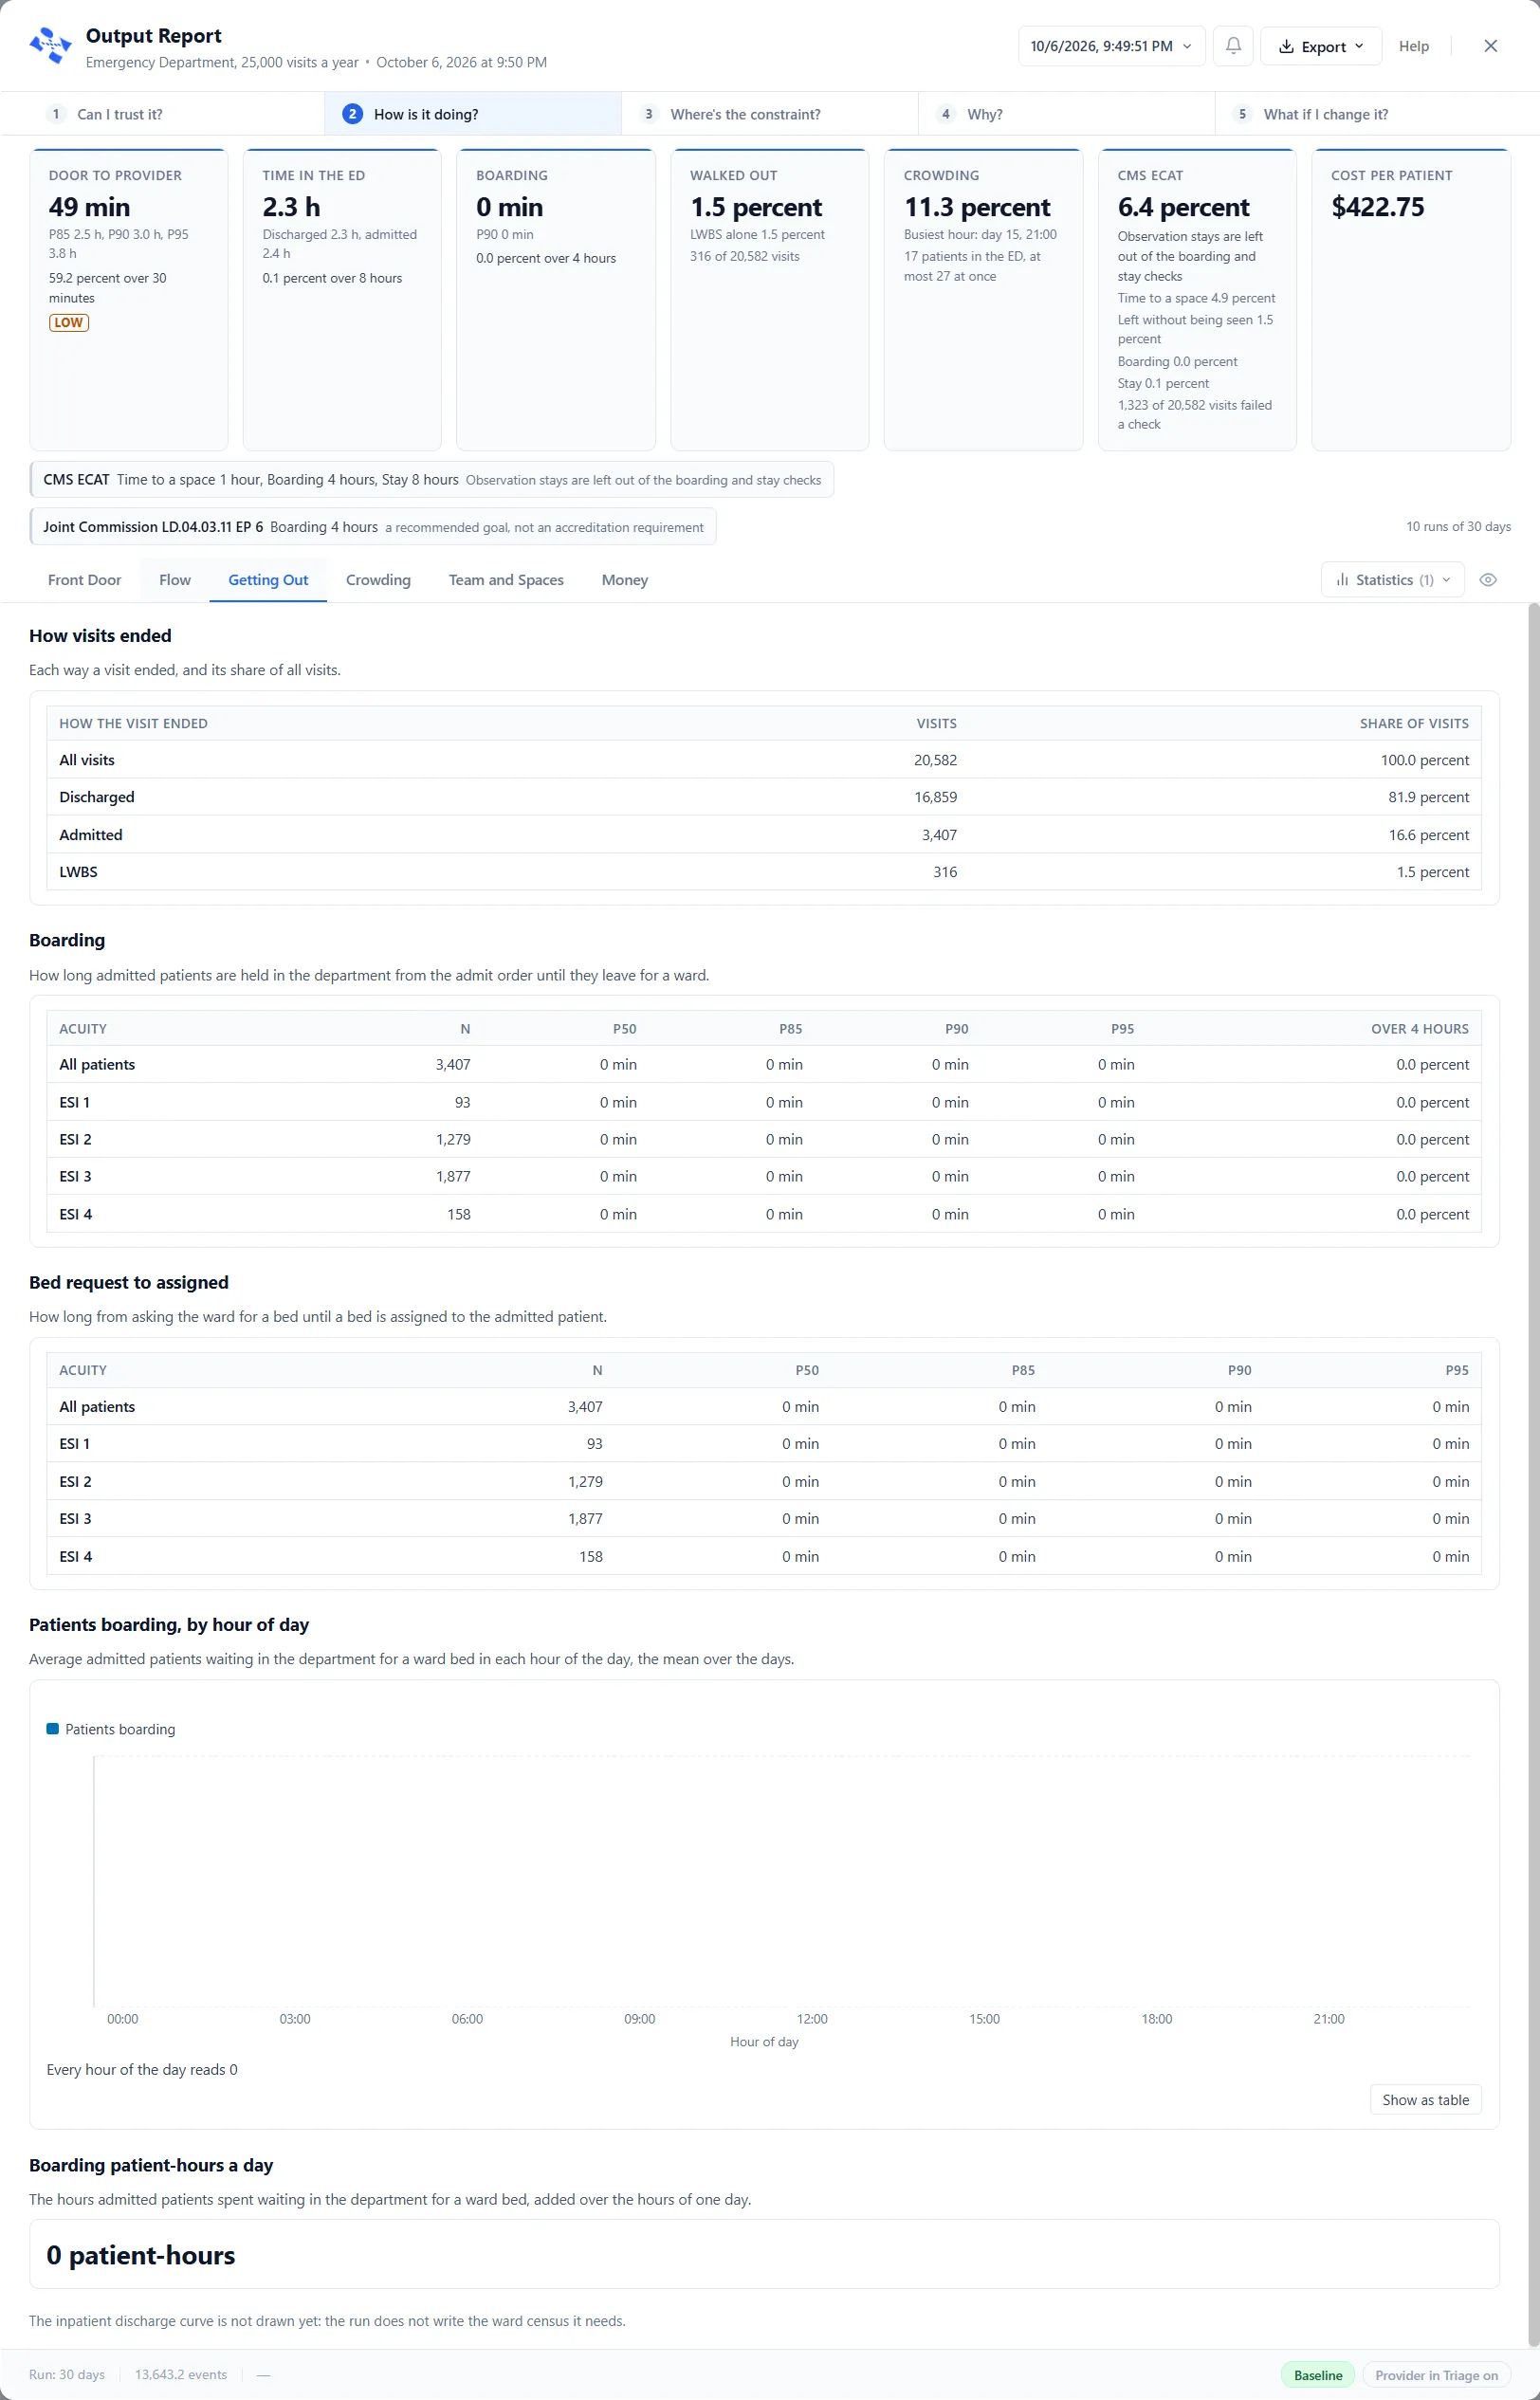
Getting Out is about how visits end and what admitted patients wait for. How visits ended gives each way a visit ended with its visits and share: All visits, Discharged, Admitted and LWBS in the picture. Boarding times how long admitted patients are held in the department from the admit order until they leave for a ward, with an Over 4 hours column. Bed request to assigned times the wait from asking the ward for a bed until one is assigned.
Patients boarding, by hour of day charts the average admitted patients waiting for a ward bed in each hour, and says “Every hour of the day reads 0” when no one boarded. Boarding patient-hours a day adds those hours over one day.
Crowding
Section titled “Crowding”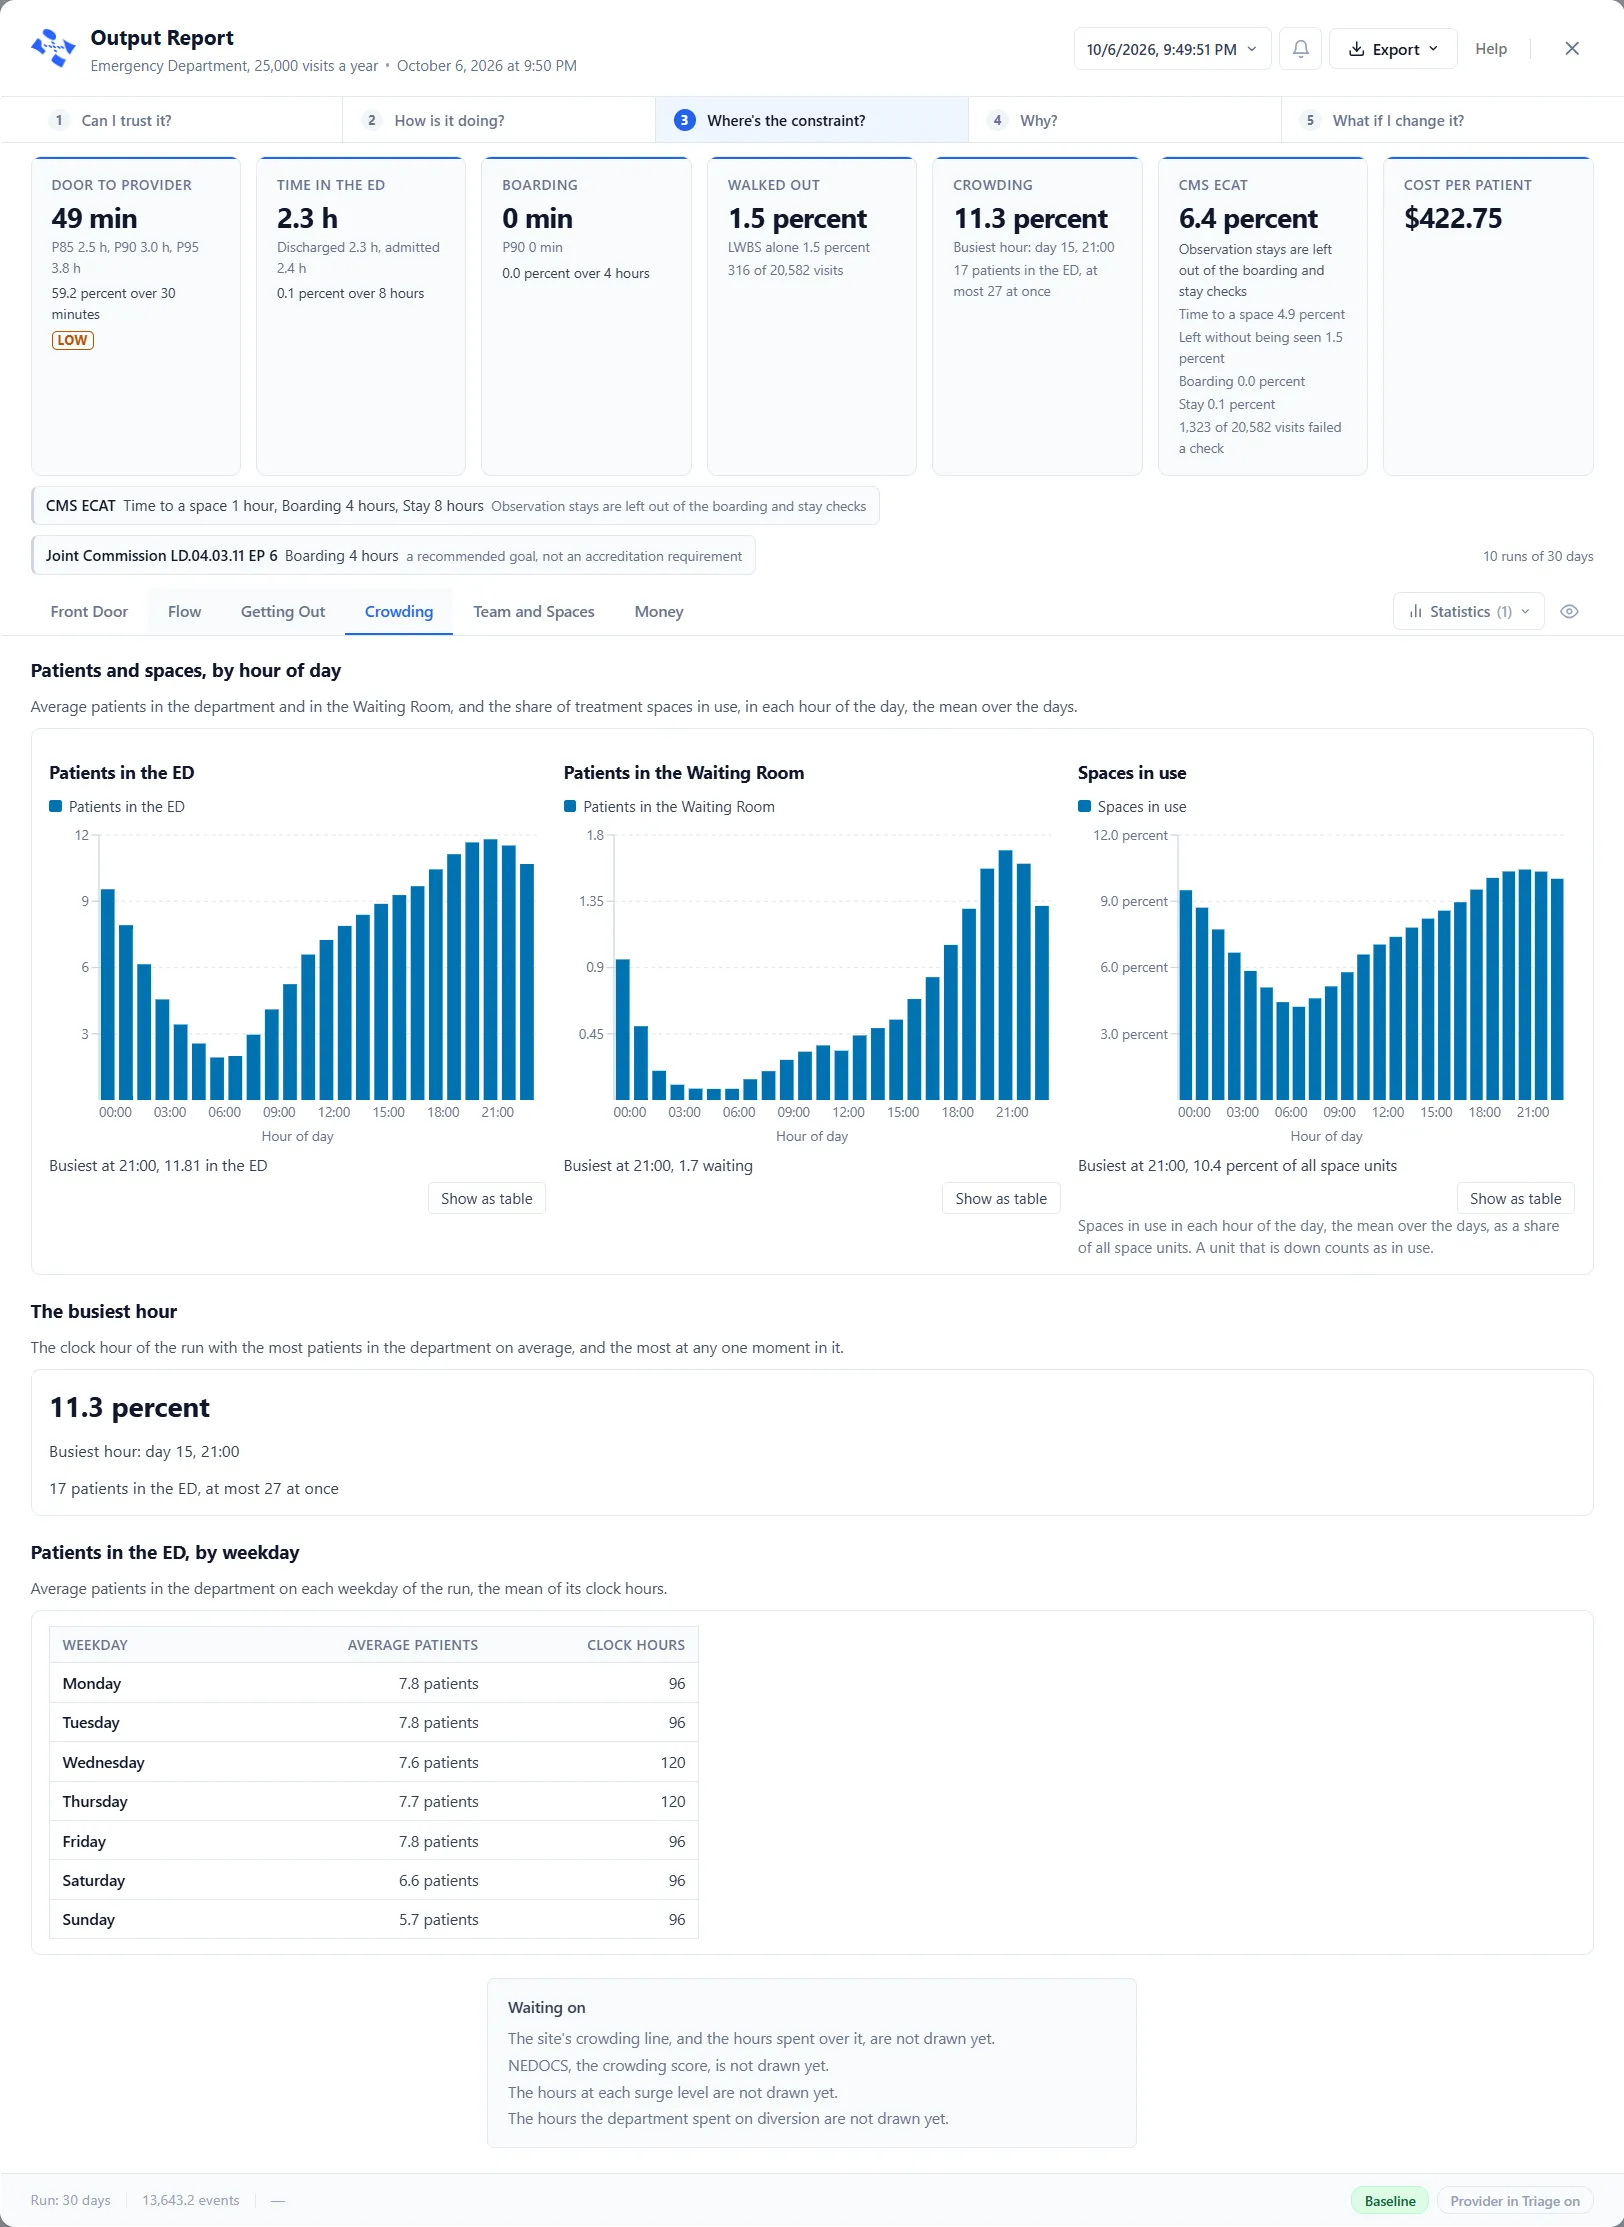
Crowding shows how full the department was. Patients and spaces, by hour of day holds three charts, Patients in the ED, Patients in the Waiting Room and Spaces in use, each naming its busiest hour. Spaces in use is a share of all space units. The busiest hour gives the clock hour of the run with the most patients in the department on average, and the most at any one moment in it. Patients in the ED, by weekday gives the average patients on each weekday.
Team and Spaces
Section titled “Team and Spaces”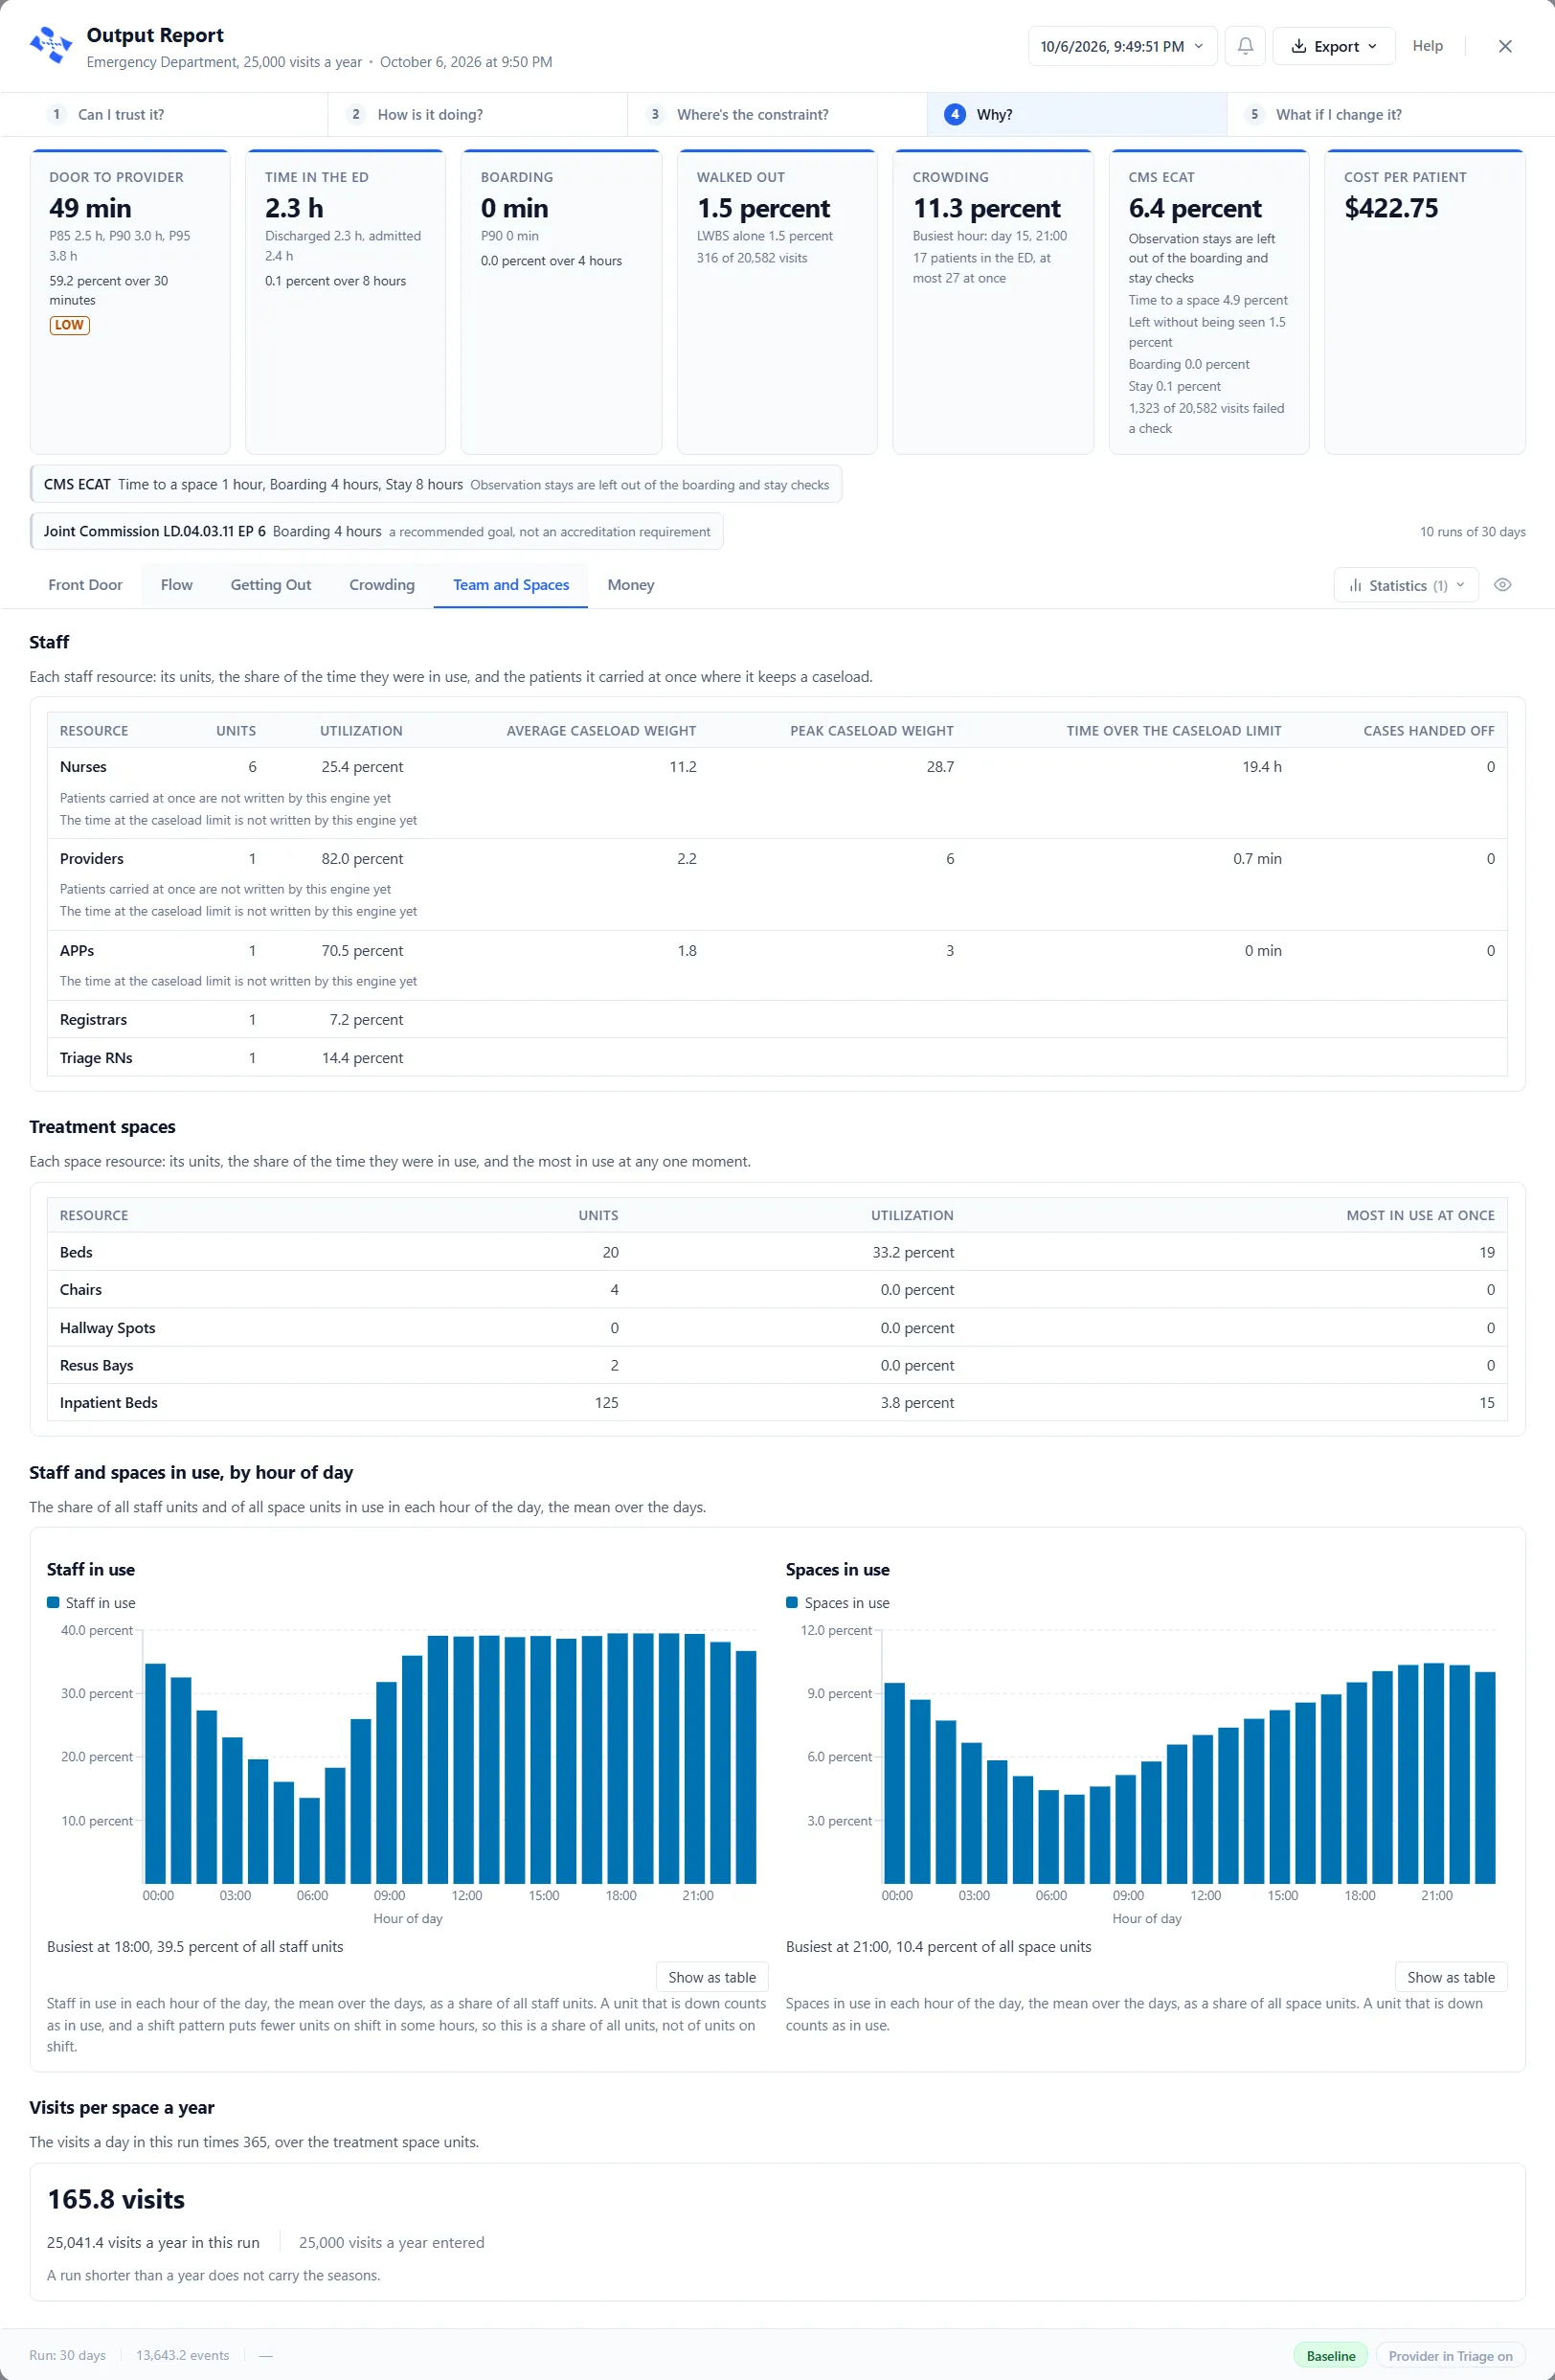
Team and Spaces reads how busy the staff and the spaces were. Staff lists each staff resource with its Units and its Utilization, the share of the time the units were in use, and, where it keeps a caseload, Average caseload weight, Peak caseload weight, Time over the caseload limit and Cases handed off. Treatment spaces gives each space resource its units, its utilization and Most in use at once. Staff and spaces in use, by hour of day charts the share of all units in use in each hour. Visits per space a year is “The visits a day in this run times 365, over the treatment space units.”