

Displaying Custom Statistics on the Screen
LegacyHow this worked in the previous version
To display custom statistics on screen during the simulation.
Example
- Display the door to doc time or doc to discharge time
- Display the WIP quantity.
- Display the % on time delivery.

Where to Find the Model Object
Section titled “Where to Find the Model Object”The following Model Object will be used to display the values:
- Visual Indicator - Display Variable - #
How to Use the Model Object
Section titled “How to Use the Model Object”- Open Your Model
- Insert the Model Object in Your Model: Locate the appropriate location where you would like to place the model object, move the view to the location and then insert the model object.
- We will change the text on the labels and change the variable reference in the properties dialog box, delete any additional lines that you do not need.
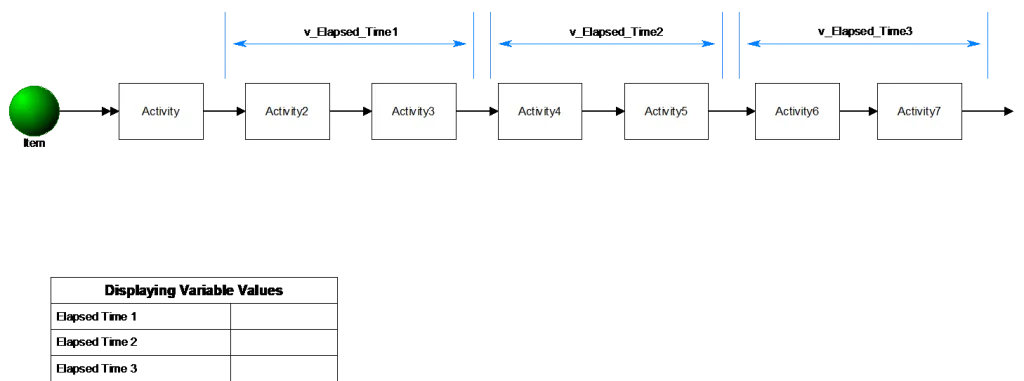
Outputs Available
Section titled “Outputs Available”Simulate the Model
Section titled “Simulate the Model”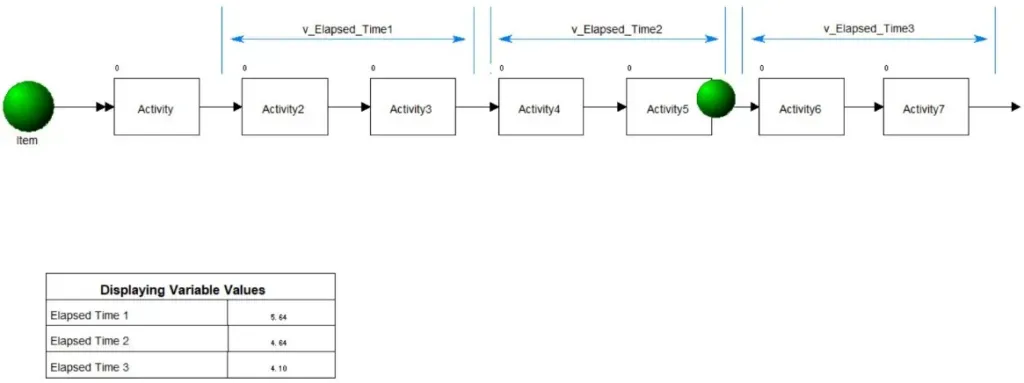
Advanced Topic
Section titled “Advanced Topic”Question: What if I need more than 10 labels?
Answer: Insert the same Model Object again, delete the header and align the labels below the ones already added, if things don’t align correctly goto ‘Arrange Grid’ and turn off ‘Snap to Grid’. Change the text on the labels and change the variable reference in the properties dialog box, delete any additional lines that you do not need.