

Triangular Distribution
The triangular distribution is the everyday choice when you have three estimates but no data: the shortest a task could take, the most likely, and the longest. It rises to a peak at the most likely value and tapers off to the two extremes.
In ProcessModel, write T(min, mode, max), or the long form Triangular(min, mode, max):
T(2, 5, 9)samples a value between 2 and 9 that peaks at 5. Use it for a processing time, a move time, or any value where an expert can give you a low, a likely, and a high. It is the most common distribution in a new model; once you have collected real data, fit a distribution to it in the Time Expression window instead.
LegacyHow this worked in the previous version
The Triangular distribution is a continuous distribution bounded on both sides. It starts at the minimum value, increases linearly to peak at the mode, and then decreases linearly to the maximum value.
The Triangular distribution is often used when no or little data is available; it is rarely an accurate representation of a data set (see Law & Kelton). This distribution is generally employed in the first stage of building a model, when time is critical and a basic understanding of the system is being developed.
The information needed for the this distribution can be captured by asking three questions:
- What is the least amount of time it has ever taken to complete this activity?
- How long does it usually take to complete this activity?
- What is the longest it has ever taken to accomplish this activity?
If example if the result of your questions were:
- One
- Three
- Seven
The distribution would be formatted T(1,3,7). The result would be entered into a time field and would produce a result of the output shown graph below:
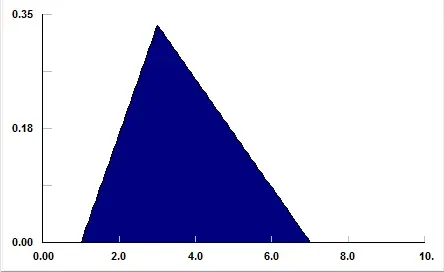
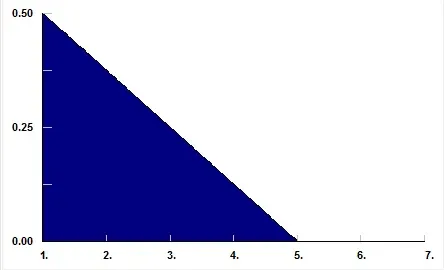
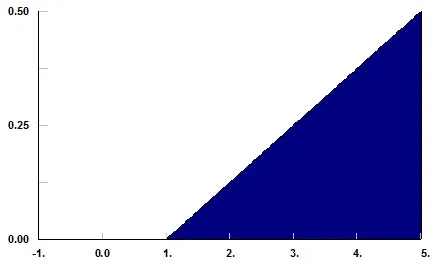
This distribution can take on very skewed forms, as shown above, including negative skewness. For the exceptional cases where the mode is either the min or max, this distribution becomes a right triangle.