

Software delivery report
When a model wears the Software lens, the Output Report speaks the delivery team’s language. Five tabs replace the general ones: Forecast, Flow, Team, Quality and Cost. Each shows only when the run has its data.
Forecast
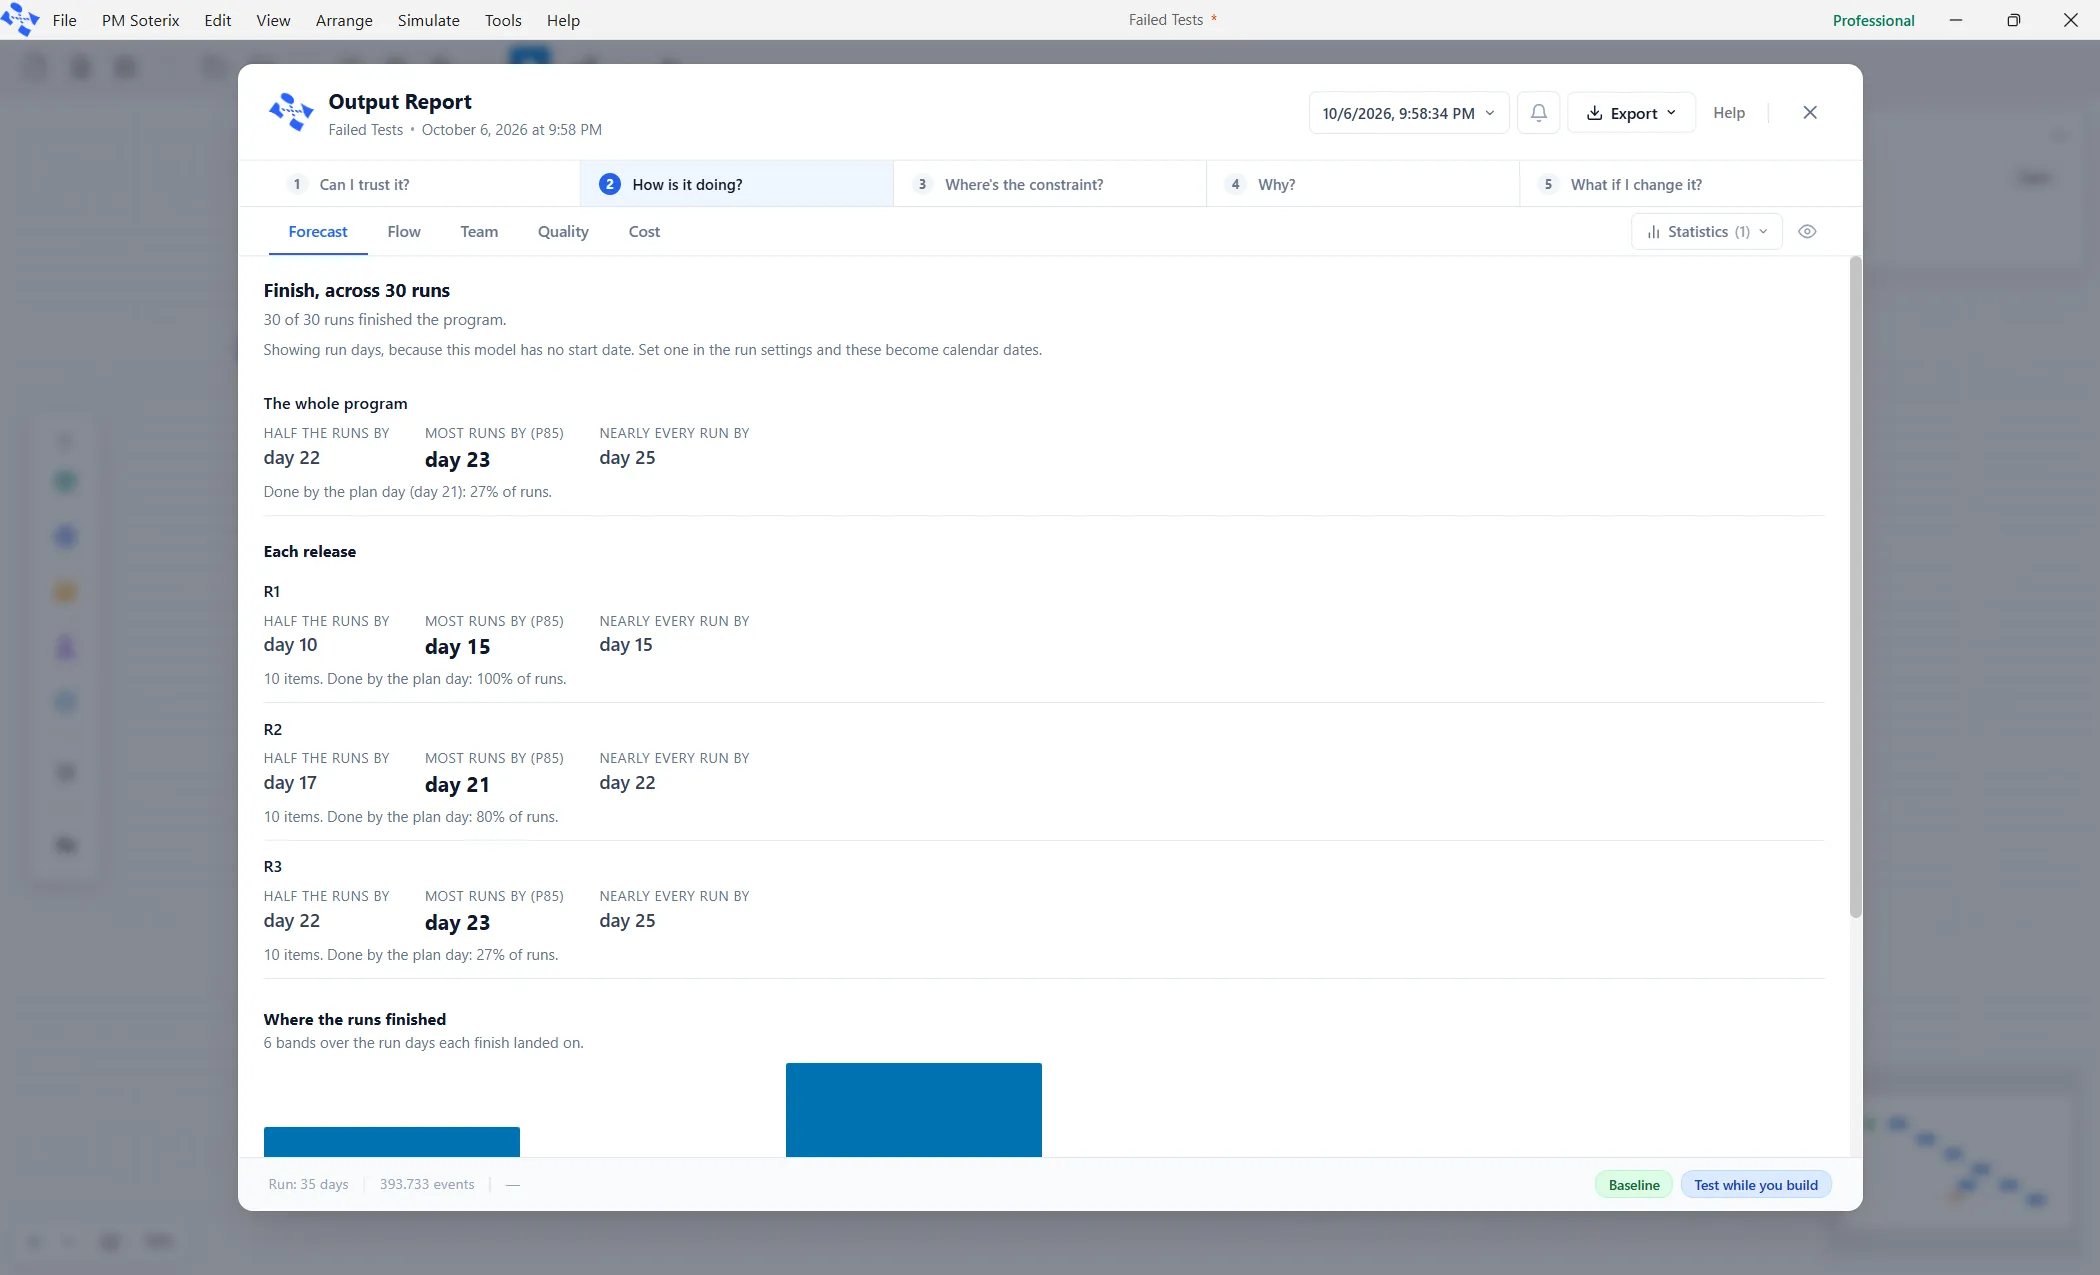
Section titled “Forecast”The Forecast tab answers when the work will be done. It reads the finish across the runs, with three readings for the whole program and for each release: Half the runs by, Most runs by (P85), and Nearly every run by, set against the Plan date. A chart of where the runs finished shows the spread. It also reads how often the plan held (“Done by the plan day (day N): X% of runs.”) and adds a Scenarios compared section.
Promise the middle reading, Most runs by (P85). The first reading is the day you beat only half the time, so promising it means being late half the time.
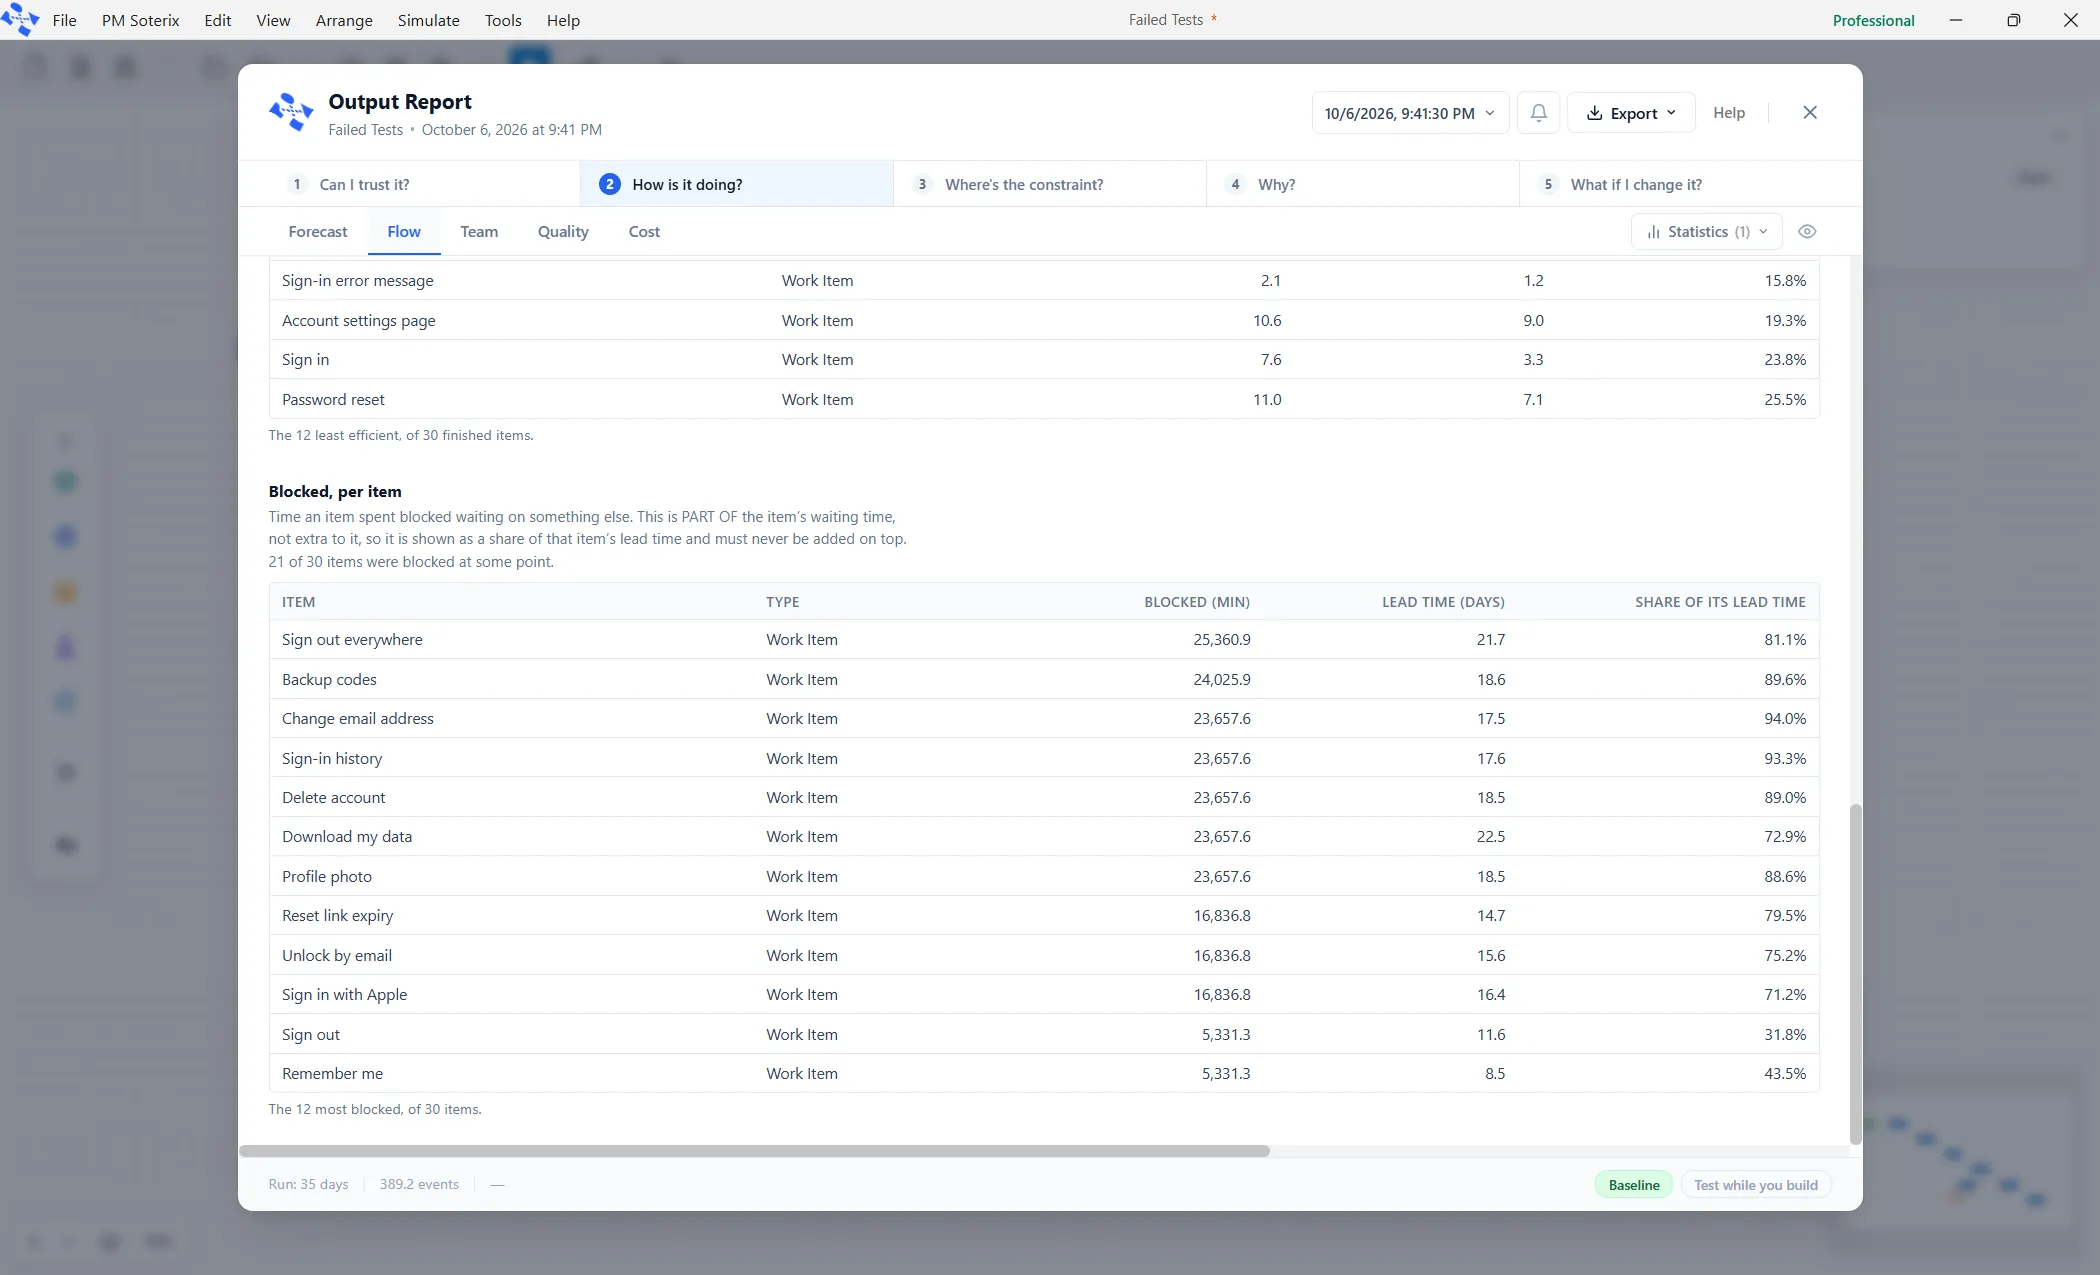
The Flow tab reads the work items. A row per work item type sits at the top, with its Lead and Cycle time at P50, P85 and P95, in days. Below it are five sections that appear once the model has a plan of work: Items finished per sprint, Open work at the end of each week, How old the open work is, Flow efficiency and Blocked, per item. Flow efficiency is the share of each item’s elapsed time that anyone was actually working on it, and ten to twenty percent is normal for a real team. Blocked, per item lists what waited and for how long. A large blocked figure means the item was waiting for another item, not for a person.
The Team tab reads how busy each team was: the utilization tiles and the Resources table. The People over time chart, with its Effective capacity line, is always on the Team tab. When the run has no weekly staffing to draw, it says “This run has no weekly staffing to draw” and names what it is waiting on.
Quality
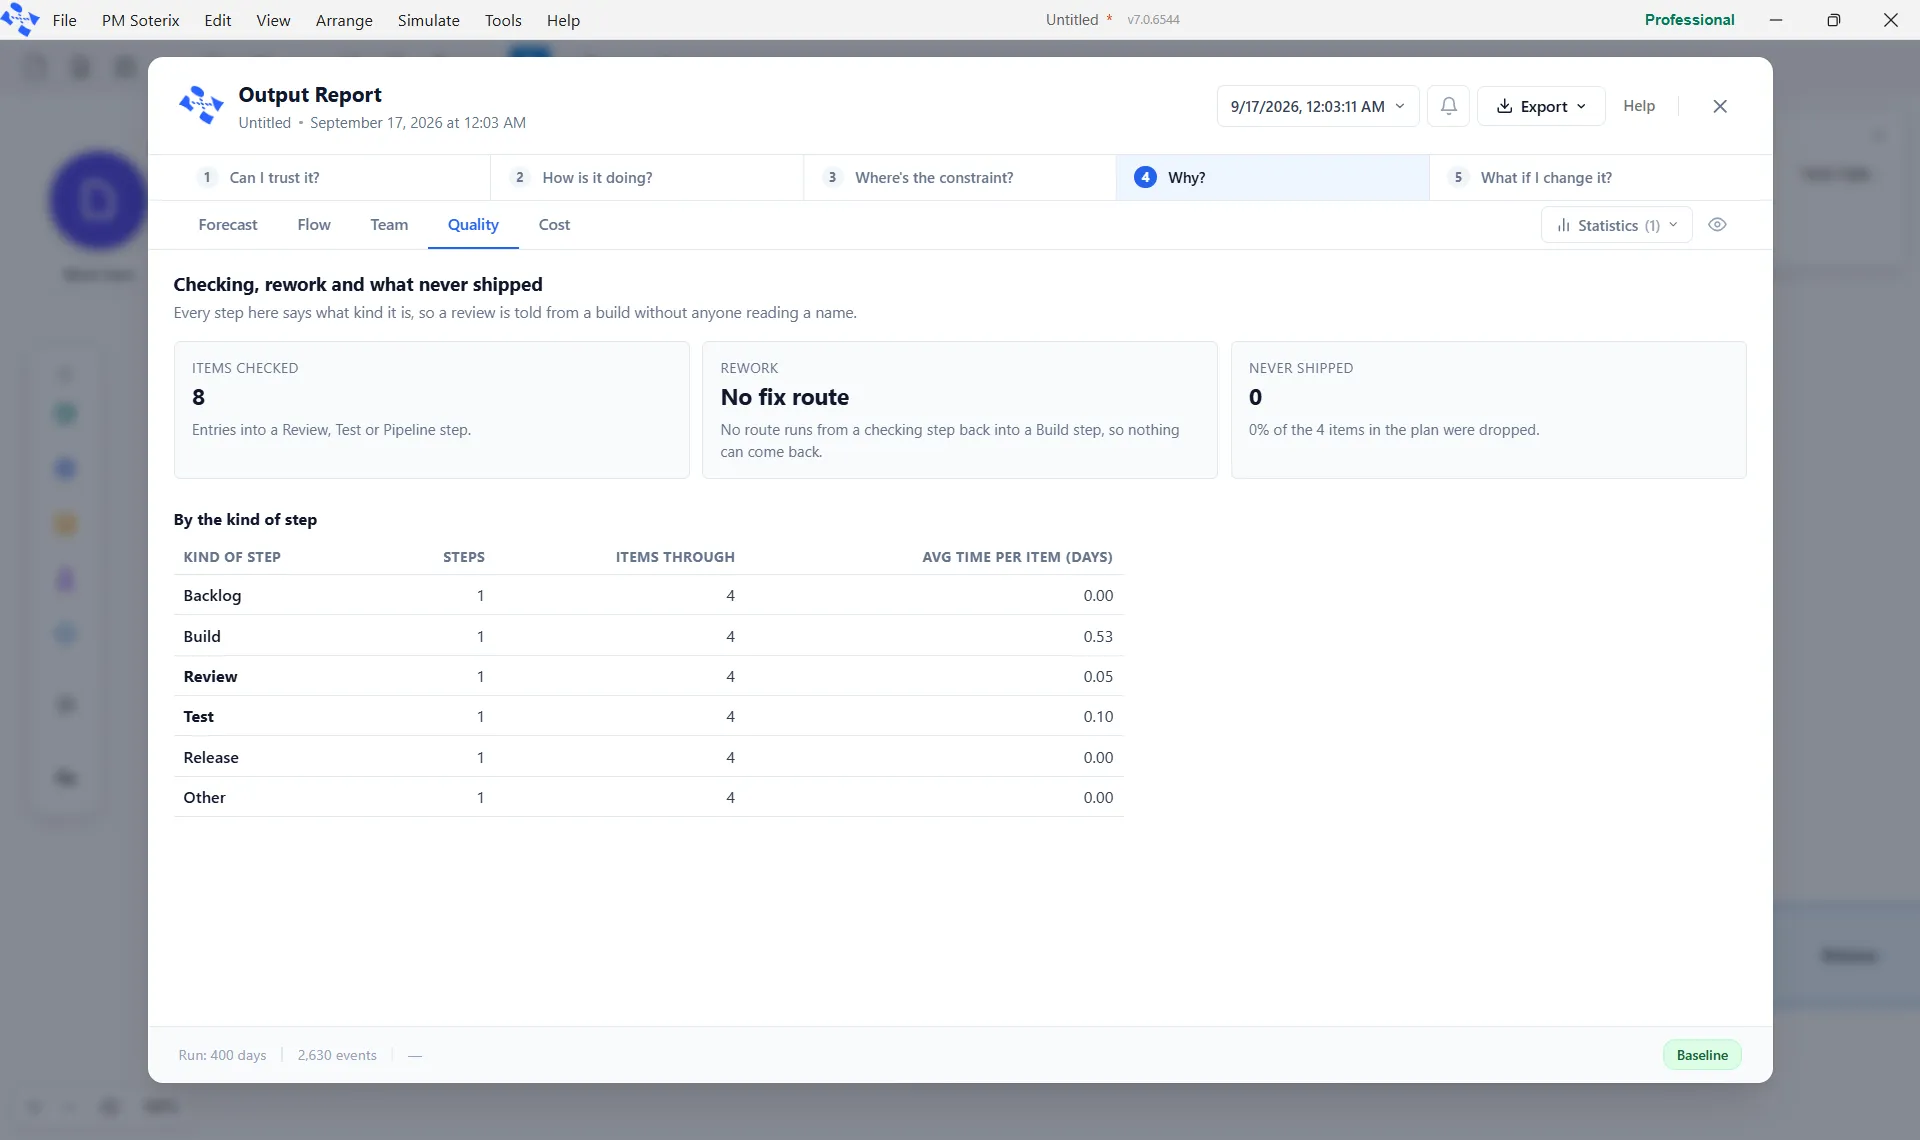
Section titled “Quality”The Quality tab is headed checking, rework and what never shipped. Three cards count the work: Items Checked is entries into a Review, Test or Pipeline step; Rework is items sent back for another pass; and Never Shipped is items dropped from the plan. With no route from a checking step back into a Build step, Rework reads that there is no fix route, which is a true answer, not a blank. Below the cards, a By the kind of step table groups the work by what kind of step did it, and a Where the work came back from section follows.
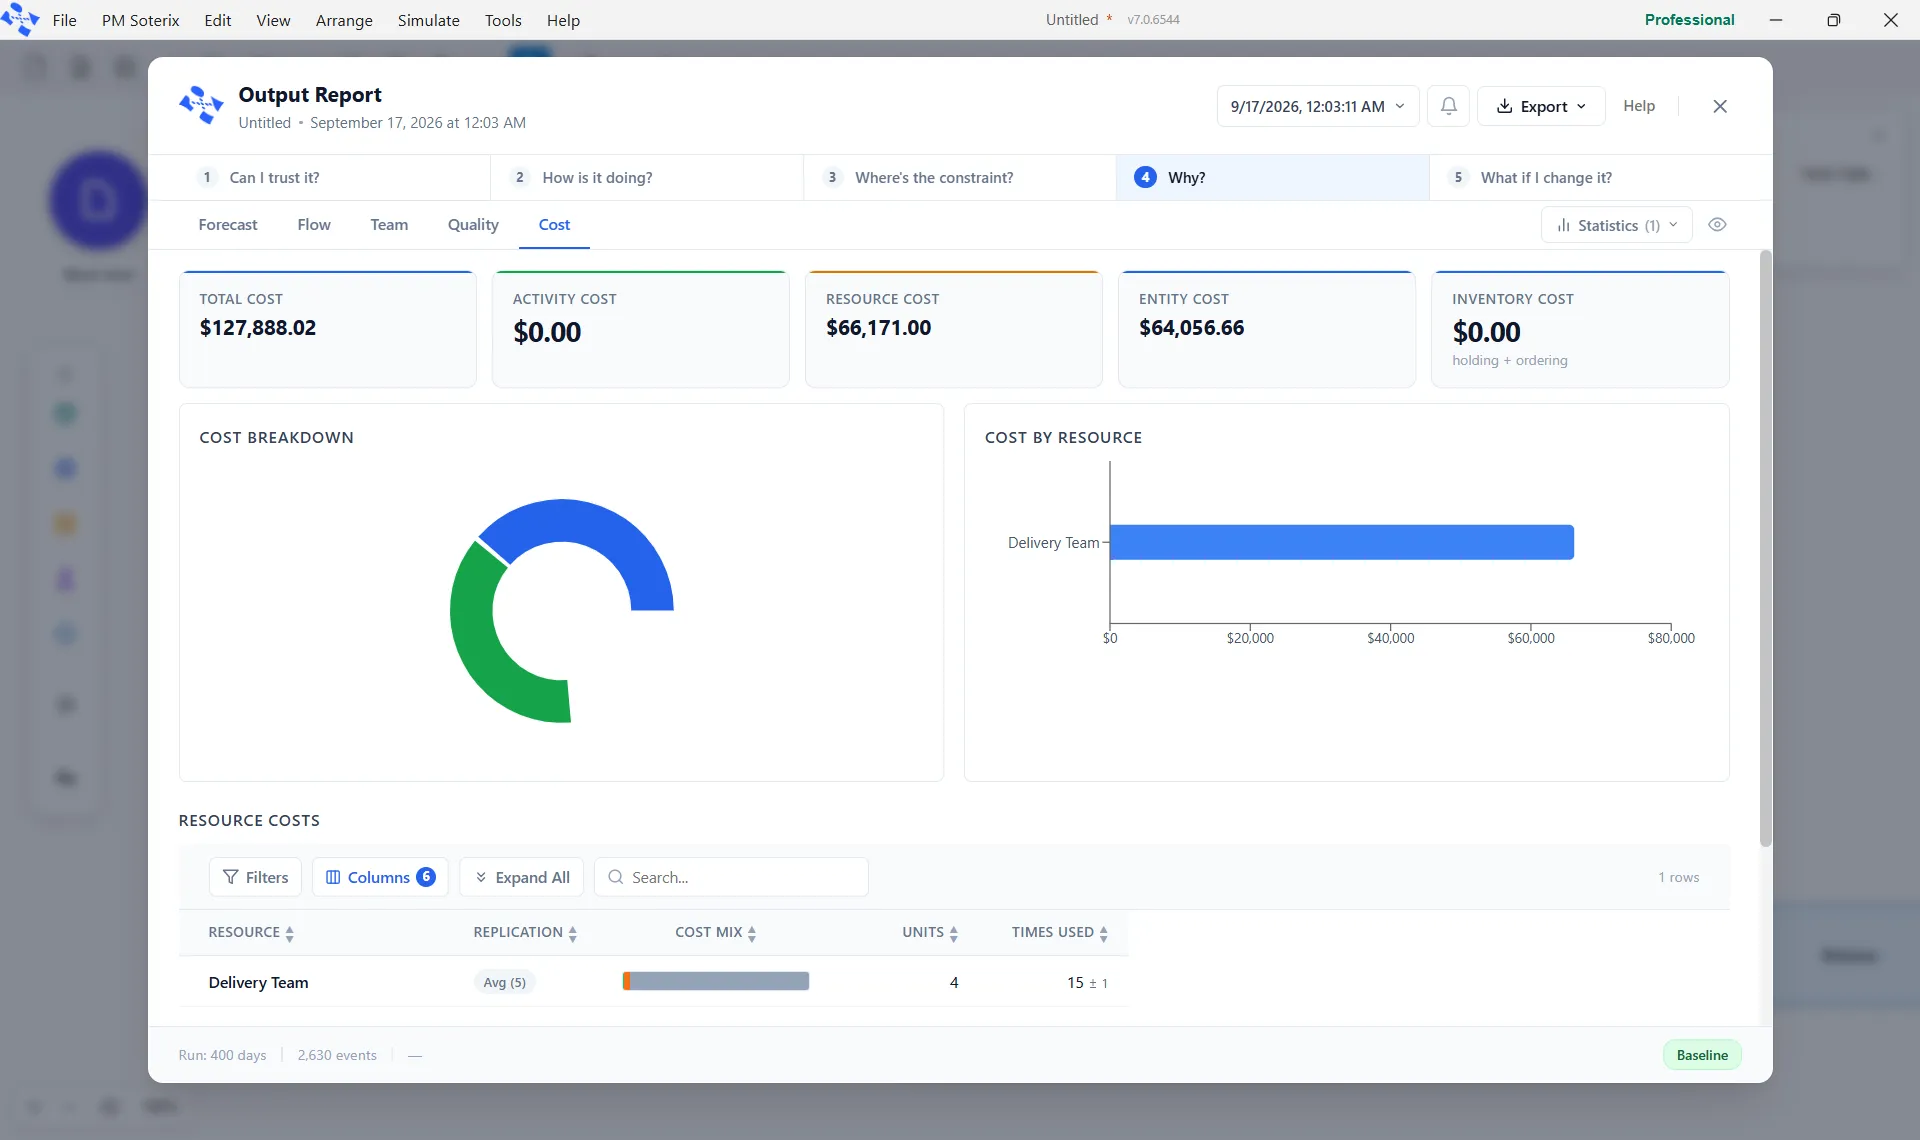
The Cost tab shows whenever the run has cost data: an entity or unused resource cost above zero, or a route cost. Five tiles head it: Total Cost, Activity Cost, Resource Cost, Entity Cost and Inventory Cost (holding plus ordering). Below them sit a Cost Breakdown donut, a Cost by Resource bar, and a Resource Costs table with the cost mix, units and times used for each team.
Fluid and bulk models
Section titled “Fluid and bulk models”A fluid or bulk model is measured, not counted, so it reads on a Bulk tab rather than these. See The Bulk report.