Simulation Options
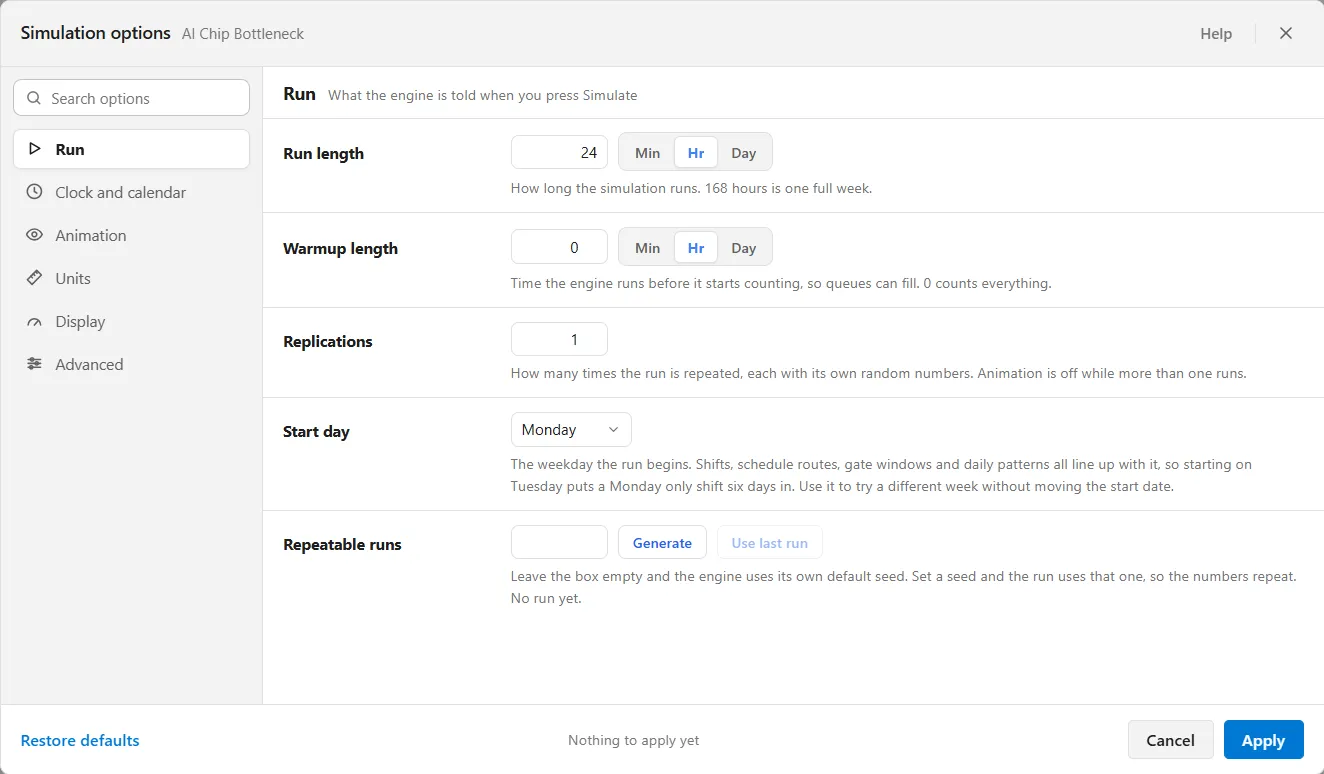
Open Simulate ▸ Options (Ctrl+Shift+O), or the gear button on the toolbar named Simulation Options, before you run a model. It cannot be opened while a run is going. The window says Simulation options at the top with the name of the model you are editing beside it, so you always know which model you are setting up.
The settings sit in groups down the left. Click a group and it fills the pane, one subject at a time, with every setting explained where it is. At the bottom, Restore defaults puts everything back and Apply saves your changes. Enter applies too.
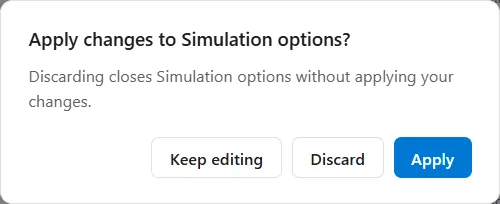
Cancel, the X and Escape close the window. If you have changes you have not applied, they first ask “Apply changes to Simulation options?”, and you answer Apply, Discard or Keep editing. A value the window cannot accept refuses Apply, jumps to the group that holds it and says what to type.
The groups
Section titled “The groups”What the engine is told when you press Simulate.
- Run length and its unit: how long the simulation runs. 168 hours is one full week.
- Warmup length and its unit: time the engine runs before it starts counting, so queues can fill. 0 counts everything. The warm-up comes first and the run length follows it, so a 30 minute warm-up before a 24 hour run simulates 24 hours 30 minutes and counts the last 24. After a warm-up the report covers only the run that follows: Total Cost, Cost / Entity, the share of a resource’s idle cost that each entity type carries, Cost Unused, and a resource’s scheduled, available, break, down and off-shift minutes all start counting when the warm-up ends. The clock reads “Warming up” until then (see Run-Time Controls), and the Overview says how many arrivals the warm-up left out (see Output Report).
- Replications: how many times the run is repeated, each with its own random numbers. Animation is off while more than one runs.
- Start day: the weekday the run begins. Shifts, schedule routes, gate windows and daily patterns all line up with it, so starting on Tuesday puts a Monday-only shift six days in. Use it to try a different week without moving the start date.
- Repeatable runs: leave the box empty and a model with no seed of its own uses the engine’s default seed. Set a seed and the run uses that one, so the numbers repeat. Generate picks a fresh seed from 1 to 99,999, and Use last run takes the seed your last run reported. The row ends with that seed, like “The last run used seed 48,123.”, or with “No run yet.” A model that was saved with a seed of its own runs on it while the box stays empty, so read that sentence after a run to see which seed was used.
A model built for delivery work changes this group in four ways. A line under Run length restates it in weeks. Two settings are added: Plan date, the day the plan says the work is due, counted from the start of the run, and Working day, how many hours a person works in a day, so effort in hours reads back as days. Warmup length and its unit are not offered, because a plan of work is a fixed list rather than a stream that needs time to settle. And Replications reads as Runs. The Forecast tab of the report then says how often the plan finished by the Plan date: “Done by the plan day (day 20): 82% of runs.”
A model built for an emergency department changes this group too (see Settings for an emergency department model). Replications reads as Runs, Warmup length reads as Settle-in time, and a Locale row is added. It sets the words and triage scale: ESI in the US, CTAS in Canada, ATS in Australia, MTS in the UK.
Clock and calendar
Section titled “Clock and calendar”How the clock reads while the model runs.
- Start date: the calendar date the run starts on. Calendar and shift-relative clocks read from it. Elapsed clocks ignore it.
- Clock format: Elapsed (HH:MM:SS), Calendar (YYYY-MM-DD HH:MM, which needs a start date), or Shift-relative (Shift N / Day M, which needs a resource with a shift schedule). During a run, the button beside the clock on the simulation bar, Change clock format, opens a menu of the three. Calendar reads “(unavailable)” until the model has a start date, and Shift-relative until a resource has a shift schedule. What you pick there is remembered on this computer and wins over the format saved here.
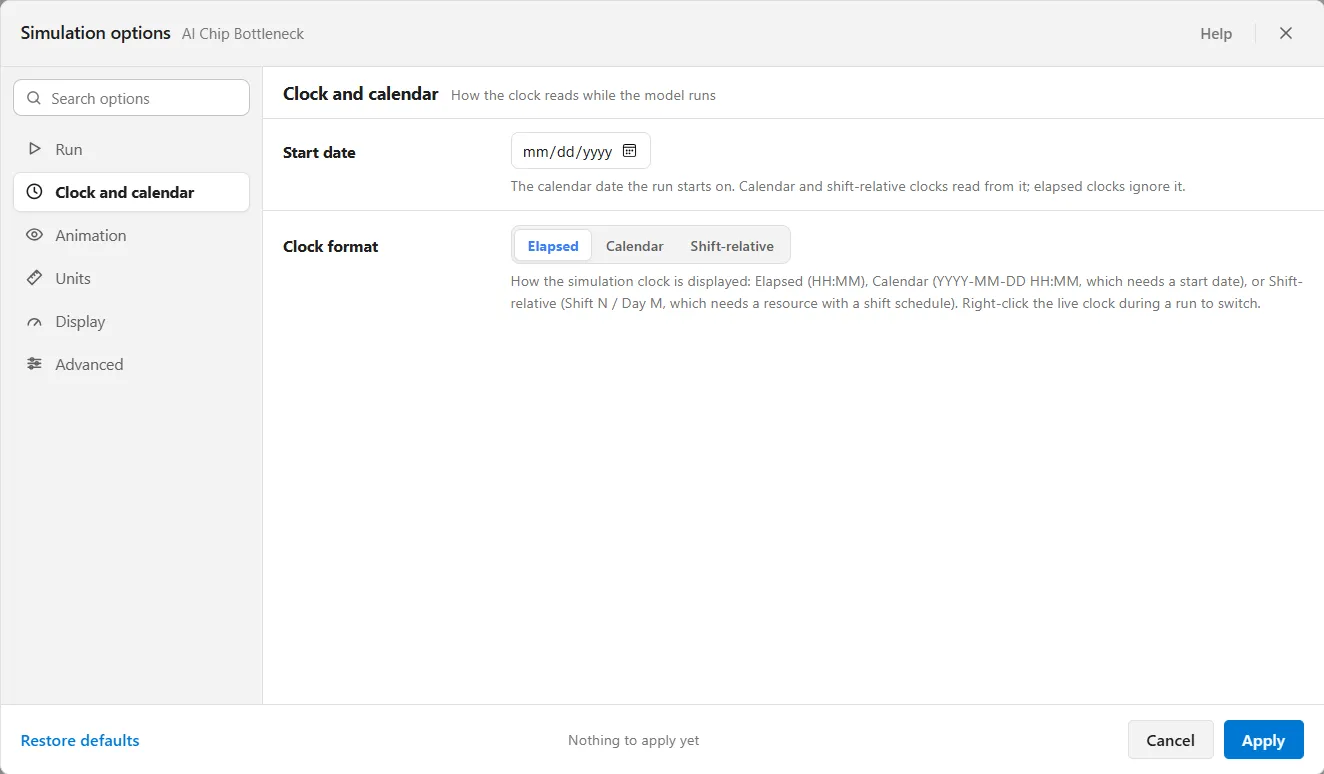
When the start day and the start date name different weekdays, a note appears under them saying so. It does not stop you: the shifts follow the start day and the clock follows the date, which is sometimes exactly what you want.
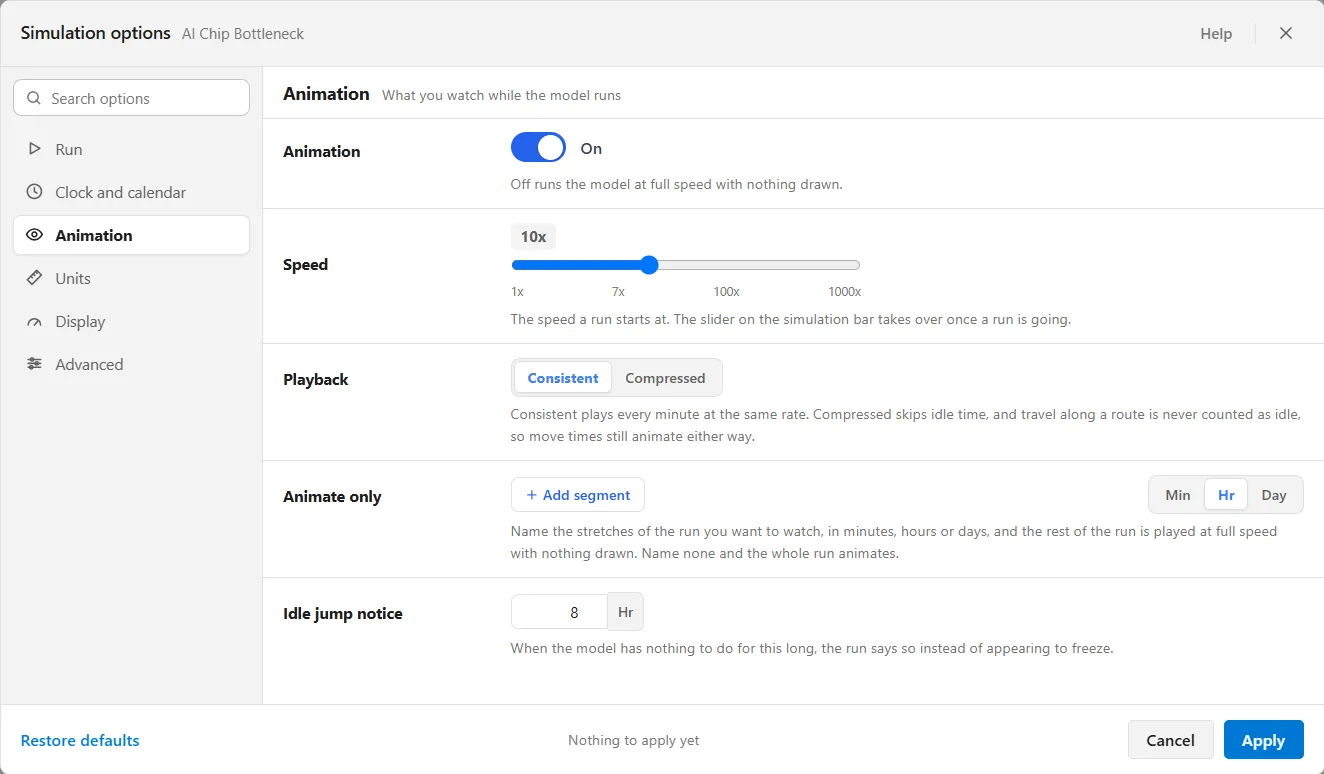
Animation
Section titled “Animation”What you watch while the model runs.
- Animation: off runs the model at full speed with nothing drawn, which is how a long run finishes fastest.
- Speed: the speed a run starts at, on the same 19 steps as the simulation bar, 1x to 1000x, where 1x is one simulated minute a second. A new model starts at 10x. The slider on the simulation bar takes over once a run is going.
- Playback: Consistent plays every minute at the same rate. Compressed skips idle time, and travel along a route is never counted as idle, so move times still animate either way.
- Animate only: name the stretches of the run you want to watch. The rest of the run is played at full speed with nothing drawn. Stretches may not overlap.
- Idle jump notice: when the model has nothing to do for this long, the run says so instead of appearing to freeze, with a note over the canvas reading “Compressed jumped N hours”. The notice appears only with Compressed playback, because only Compressed jumps.
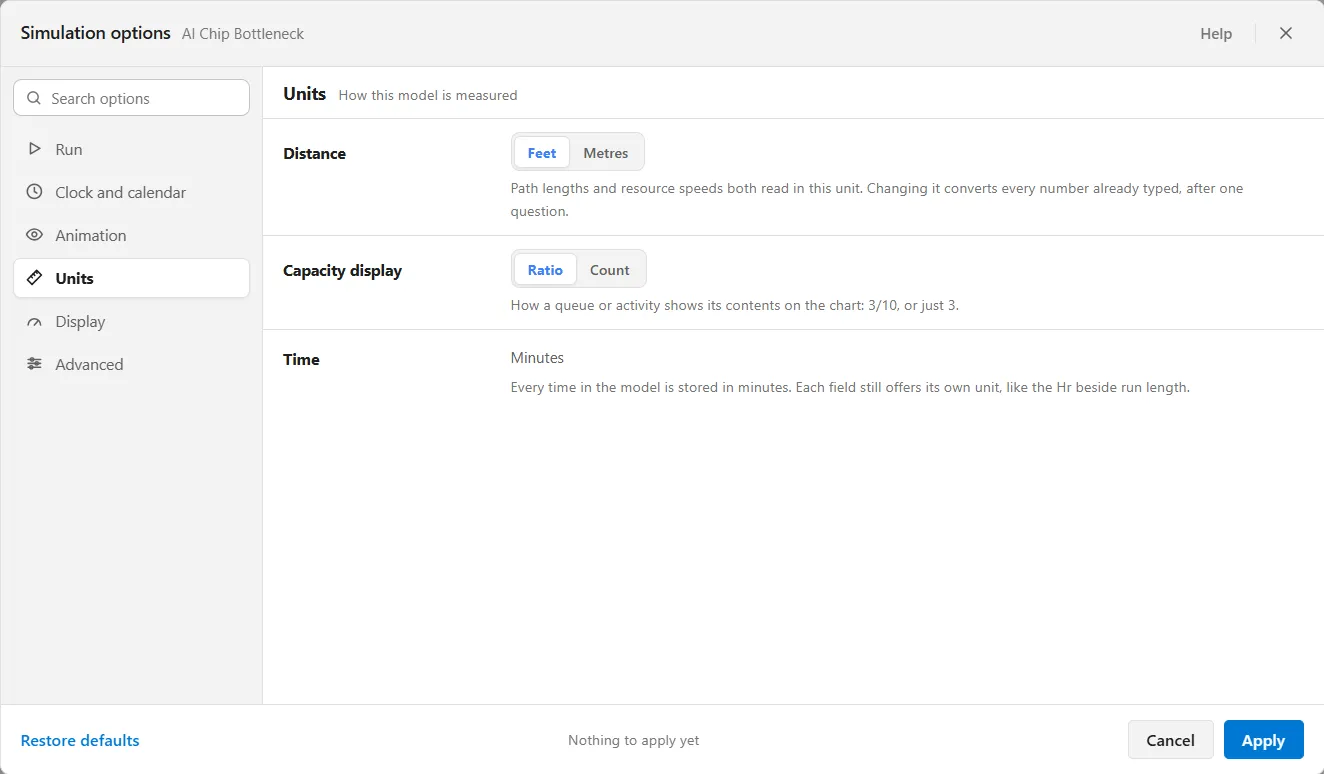
How this model is measured.
- Distance: Feet or Metres, one unit for the whole model, so a length and a speed can never disagree. Today nothing in a model is measured in distance, so switching it converts nothing and asks nothing. See Changing the distance unit below.
- Capacity display: how a queue or activity shows its contents on the chart. Ratio shows 3/10, Count shows just 3.
- Time is a fact rather than a setting. Every time in the model is stored in minutes. Each field still offers its own unit, like the Hr beside run length.
Display
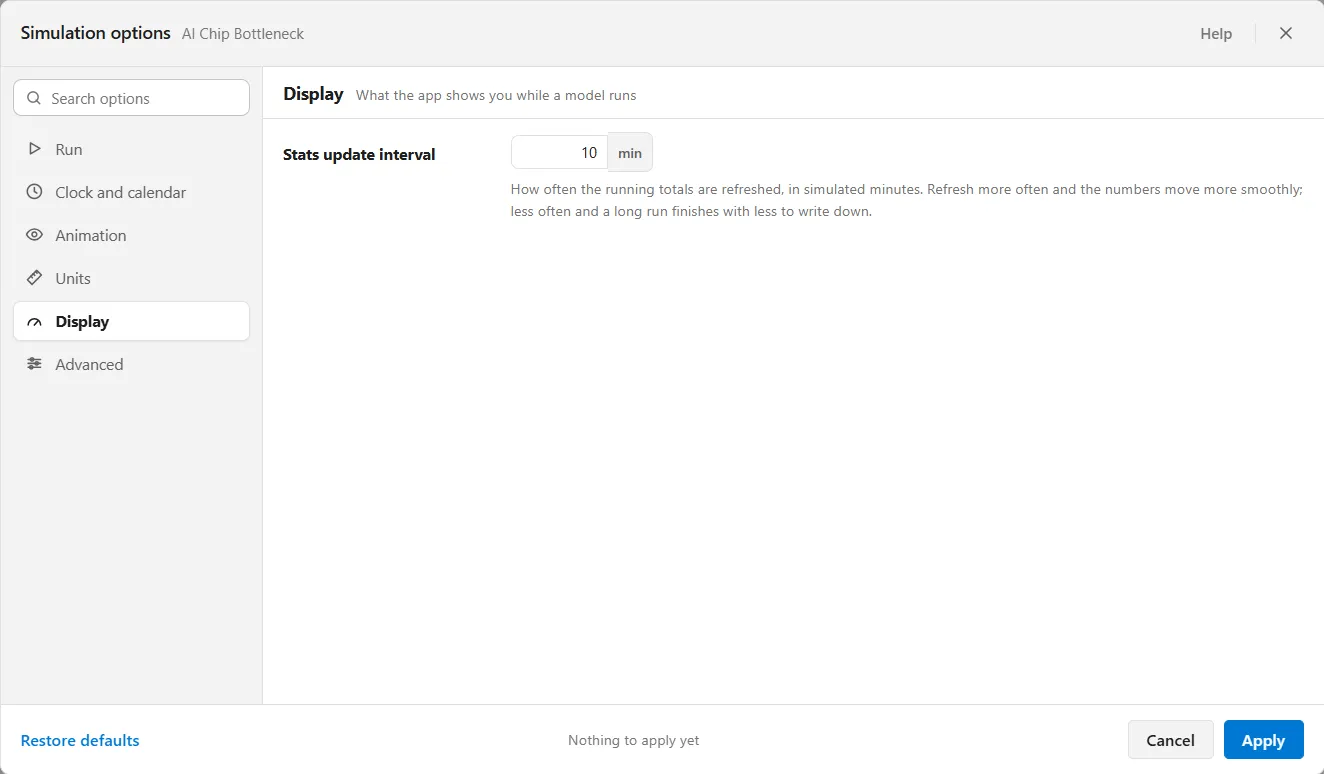
Section titled “Display”What the app shows you while a model runs.
- Stats update interval: how often the running totals are refreshed, in simulated minutes. Refresh more often and the numbers move more smoothly; less often and a long run finishes with less to write down.
The live cards that sit over the canvas while a model runs are not a setting here. They are described in The Simulation Window.
Advanced
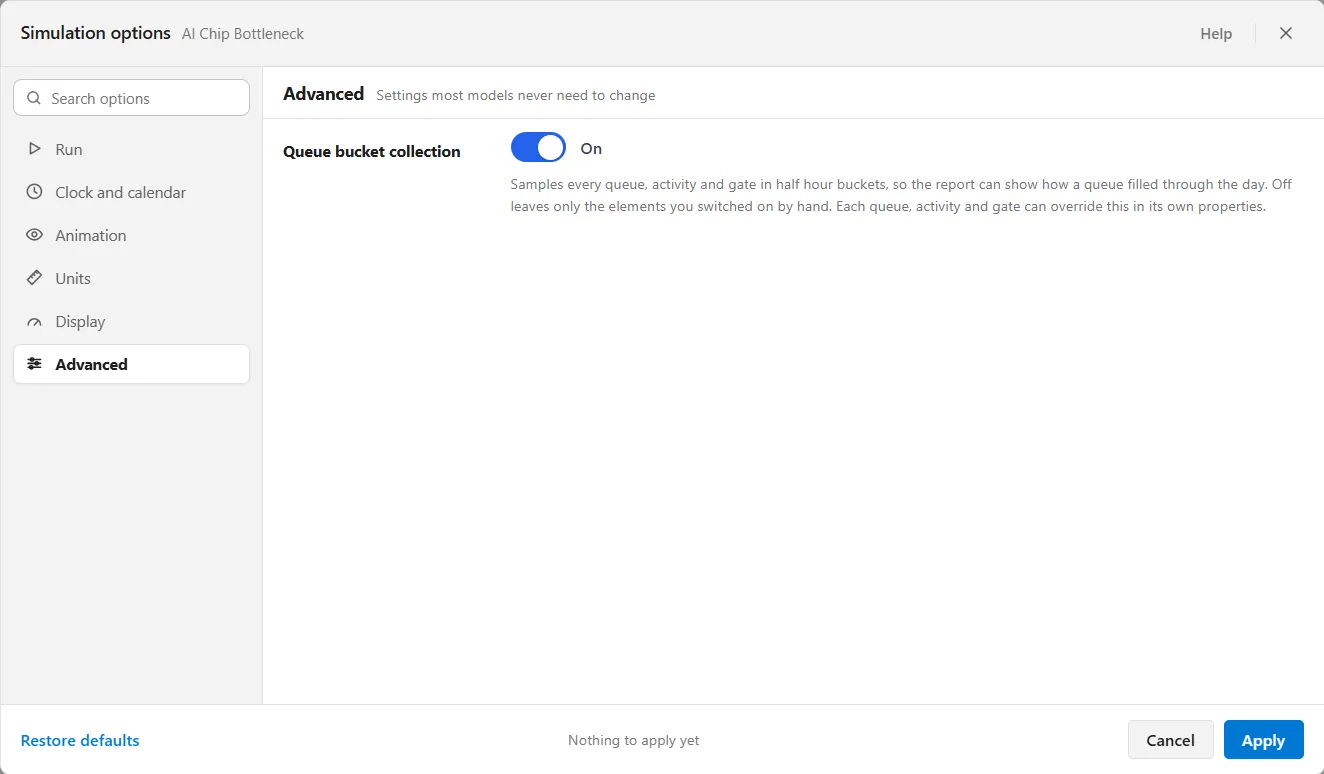
Section titled “Advanced”Settings most models never need to change.
- Queue bucket collection: samples every queue, activity and gate in half hour buckets, so the report can show how a queue filled through the day. Off leaves only the elements you switched on by hand. Each queue, activity and gate can override this in its own properties. It feeds the Queue Diagnostics heatmap.
Groups an industry adds
Section titled “Groups an industry adds”The groups above are the ones most models show. Two more appear, after Units, on a model that wears the Emergency Department lens, which comes with the Healthcare palette. To put a model under a lens, open View ▸ Show Industry Palette and choose the industry (see Industry palettes and the lens).
- Costing: which part of the emergency department each dollar belongs to. Every cost center in the model is listed, and each sits on the ED side or the hospital side. A hospital side cost shows on its own line in the report and is not counted in cost per patient.
- Report rules: the lines the report is scored against. Acuity attribute names the patient attribute that holds the triage level, Walk-outs in length of stay counts patients who walked out in the length of stay, and Report lines sets the minutes each wait is scored against.
No other industry adds a group. The Software lens changes rows inside Run, as that group describes, and the Dairy, Fluids and Bulk faces add nothing here. A plant model’s Expected shrink is not set in this window: it is the last row of the Definitions panel (see Materials and the Definitions panel).
Finding a setting
Section titled “Finding a setting”Type in the Search options box at the top of the group list and every group is searched at once, on the name of each setting, on the words of its explanation, and on the name of the group it sits in. That last one is why searching for a group returns the whole group rather than a couple of stray rows. The results are labeled with the group each came from, and the heading counts what was found, like “4 options in 2 groups”. The settings are live in the results, so you can change one where you found it.
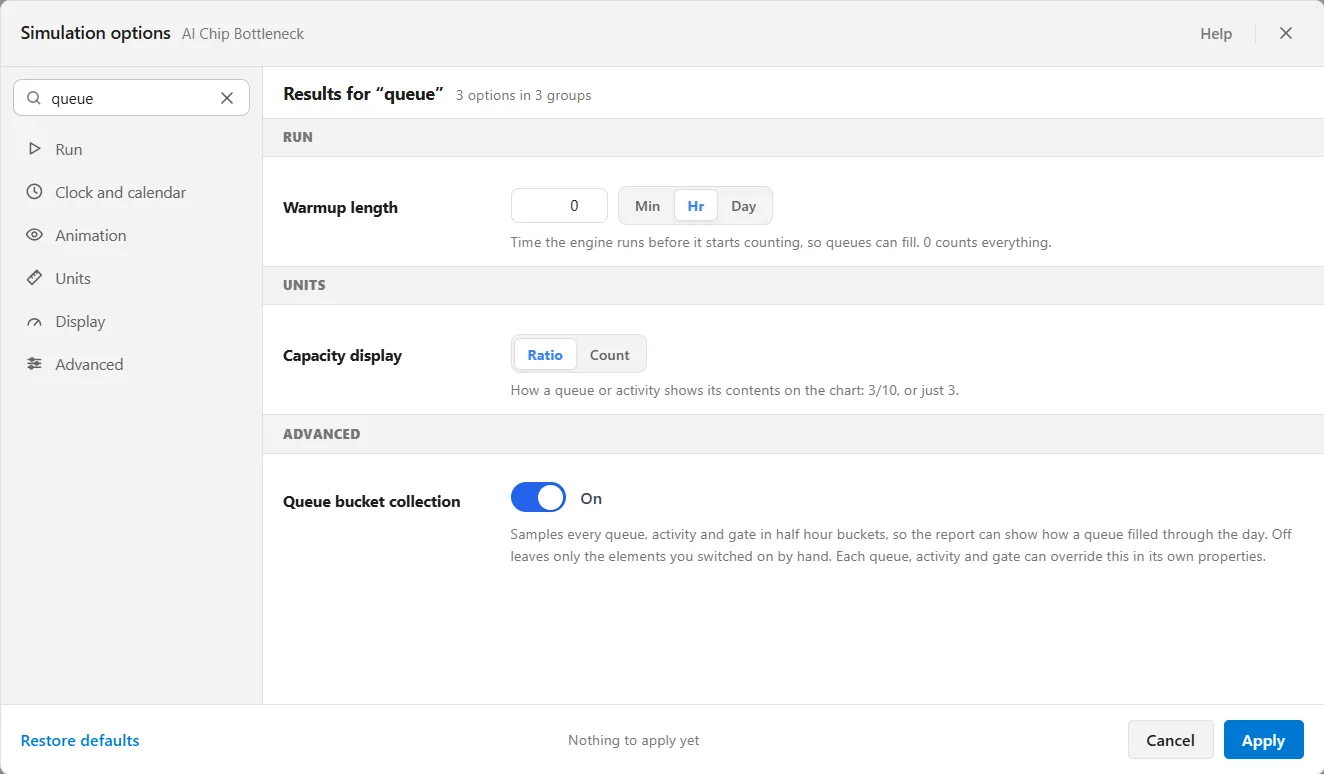
If nothing matches, the pane says so and offers to take you back to the group you were in. Pressing Escape clears the search rather than closing the window.
What you have changed
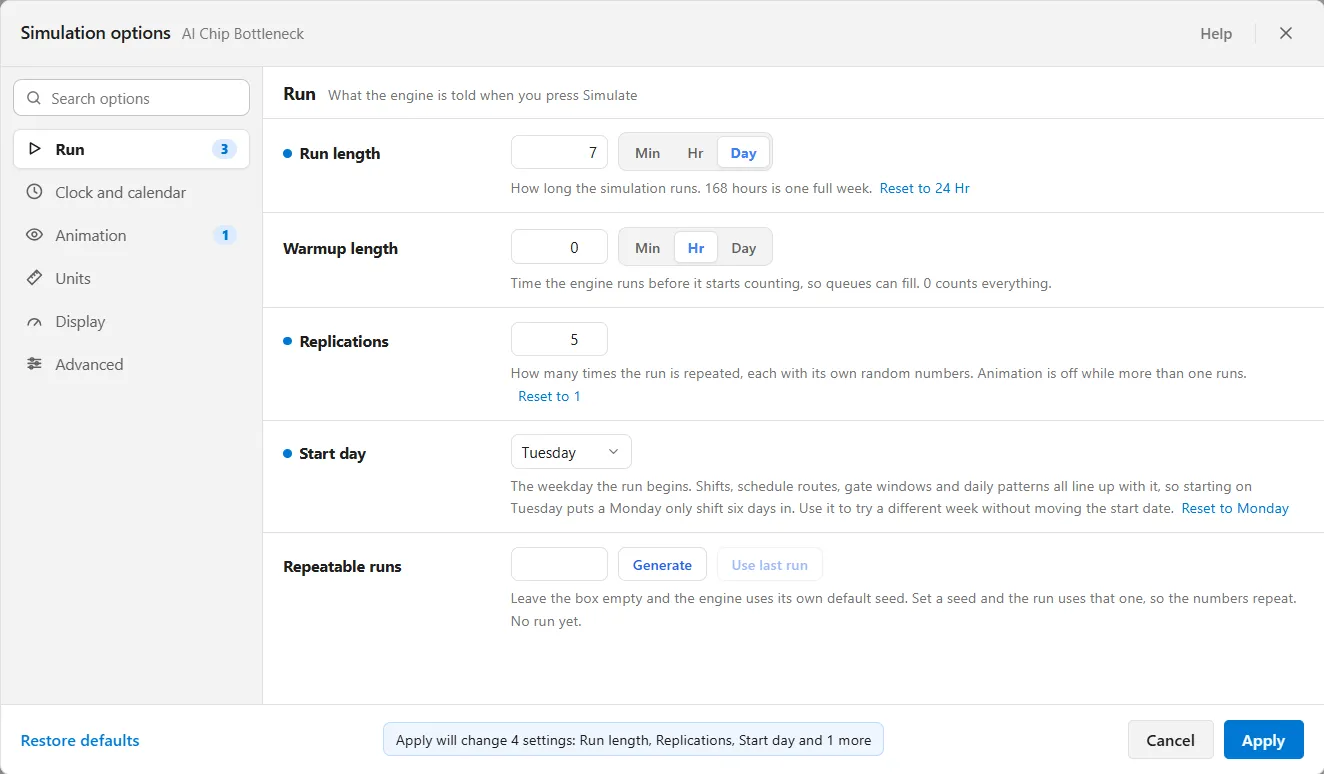
Section titled “What you have changed”A setting that is not on its factory default carries a small blue dot beside its name, and its explanation ends with its own reset, reading Reset to 24 Hr or Clear where the default is nothing. Resetting one setting leaves every other one alone. Each group in the list shows how many of its settings are marked, so you can see at a glance where a model has been tuned.
The dots measure against the defaults. The line at the bottom of the window measures something else: what Apply is about to write. It reads Nothing to apply yet until you change something, then names it, like “Apply will change 2 settings: Run length, Speed”. With more than three changes it names the first three and counts the rest, like “Apply will change 4 settings: Run length, Replications, Start day and 1 more”. Restore defaults changes things too, so the line then names everything it moved.
Speed and playback while a run is going
Section titled “Speed and playback while a run is going”Speed and Playback are the values a run starts with. Once a run is going, the simulation bar owns them, and the bar keeps them after the run ends. So the two can disagree.
When they do, the setting shows a note saying what the simulation bar is on, like “Simulation bar: Compressed”, with Use the simulation bar value beside it to adopt it in one click. When they agree there is no note, because two values agreeing is not news.
Changing the distance unit
Section titled “Changing the distance unit”One distance unit covers the whole model, so a length and a speed can never disagree. Today, switching it is silent: nothing in a model is measured in distance, so there is nothing to convert and no question is asked. The unit just changes.
Once a model has real path lengths or resource speeds to convert, switching the unit asks first, naming exactly what it will change, like “Change 37 lengths and 4 speeds from feet to metres?”. Say Change and every number you typed is converted, so the floor stays the same size and no travel time changes. Say Cancel and nothing moves. The conversion happens when you press Apply, not when you click the unit, so a window you cancel has changed nothing.
Restore defaults reaches the distance unit the same way. If putting it back would move it, you get the same question switching the unit by hand asks, so a reset can never silently reinterpret the lengths you typed.
LegacyHow this worked in the previous version
Accessed from the Simulation menu, the Options dialog contains the settings and information you will use to run your model. Be sure to review these settings before running the simulation of the model. Once you are familiar with these options and have set them according to your objectives, you can run the simulation.
If the first entity arrives in the model at 8:00am the simulation clock will jump ahead to that event. This happens when there is a daily pattern or scheduled arrival of entities to occur at 8:00am. If no events are occurring in the simulation, the clock jumps ahead to a point when some action is taking place.
Each ProcessModel simulation begins at 12:00 a.m. (midnight) on Monday morning (of the first week).
Run Tab
Section titled “Run Tab”Run length The length of time for running the simulation. You may use any constant or expression to indicate the length of time the simulation will run.
The longest a model can run a simulation for is 71,582 hours or 2,982.6 days or 8.17 years approximately. The smallest time allowed is .06 seconds, .001 minutes, or .000017 hours.
Warmup length The length of time to run the simulation before collecting statistics. Many systems require a time to warm up before they are running at a steady state, and if you collected statistics during this warm-up period, your results would likely be skewed. This option allows you to define that time to allow your model to warm up before you begin collecting statistics. Again, any constant or expression may be used in this field. The scoreboard values will reset after the warmup period ends. This is the designed purpose of the warm up length.
The longest warm-up length allowed is 17,520 hours.
What are replications? A replication is a repeating run of a simulation experiment changing the random number seed. Changing the random seed means the variation changes - as if you could observe different periods of data. Monitoring different data sets or replications allows a more realistic representation of what could happen due to stochastic parameters. Without replications, the simulation won’t produce statistically significant results, nor will it allow for proper calculation of statistical data.
Use replications when running comparisons, testing variation, and performing risk analysis.
Report time units Allows you to select the default time units to use when you run the model.
Show Animation If checked, the process will be animated during the simulation. Disabling the animation enables the simulation to run faster and consumes less memory.
Show Scoreboard Check to display basic performance measures (entities processed, value-added time, etc.) during the simulation.
Scoreboard Time units Allows you to select the time unit displayed in the scoreboard at the time of simulation.
Disable sub processes Causes the simulation to be run the main model only (no submodels are executed). Individual submodels can be disabled in the Activity dialog.
The ProcessModel simulation clock runs straight time using 24 hour days, 7 days per week. If there is a need to avoid the shift files to compensate for evenings and weekends, just run straight work time (not being concerned with the “day of week”), it can reduce the simulation run length to 40 hours per week. For example, a normal 7 day work week is 168 hours (7 x 24). To run a model without shift files for 4 weeks, using a 5 day workweek at 40 hours per week, reduce the run length from 672 hours (4 x 168) to 160 hours (4 x 40). Caution: Daily Pattern or Scheduled arrivals can not be used with this technique because the clock is no longer tracking 24 hour days. Continuous, Periodic, or Ordered arrivals will need to be used.
Files Tab
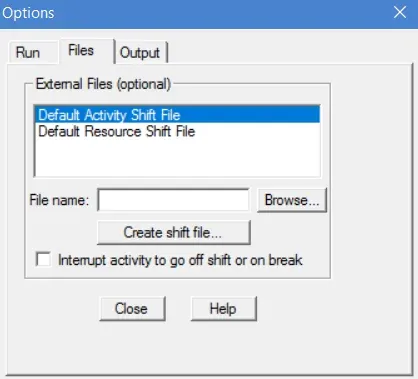
Section titled “Files Tab”External Files This option allows you to include shift files for activities and resources.
Create shift file Allows you to create a shift file for the model.
Interrupt activity to go off shift or on break When you check this option, ProcessModel will interrupt an activity or resource (whether or not it is currently busy) to cause it to go off shift or on break. Use this only for activities or resources you can interrupt.
Graphics Tab
Section titled “Graphics Tab”ProcessModel version 5.6.2 and above do not support this feature. The Graphics tab allowed you to use a custom graphics library in the model and was provided primarily for compatibility with earlier versions of ProcessModel. If you have models built in version 2.1 or earlier and you don’t want to add any custom entity icons to the models, uncheck the “Use custom graphics library for simulation” box. This will conserve the disk space required to generate a custom graphics library.
Output Tab
Section titled “Output Tab”Show standard deviation When you check this option, ProcessModel will show standard deviation in the cycle time calculation of the Output Summary.
Number of cycle time Allows you to choose the size of the cycle in which the standard deviation is sampled. Larger samples use more processing memory.
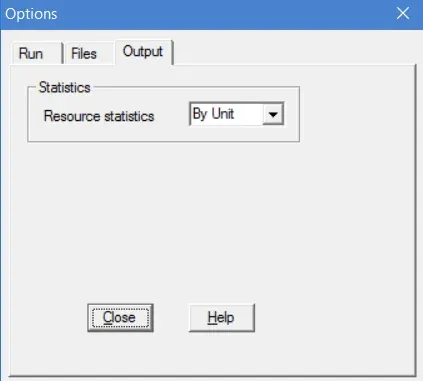
Statistics Allows you to choose if resource stats will be shown by unit or in a summary of all units.