

Building a Software Development Model
A guide for someone opening ProcessModel for the first time.
Before you start
Section titled “Before you start”This guide assumes you have never opened ProcessModel and that nobody is sitting beside you. Every instruction names the menu, the button, and the field to use, and says what should happen next. Where a number is given, it is the number this build produces, so you can check your screen against the page.
You need ProcessModel installed and about two hours. Work through it in order. Parts 1 and 2 explain what you are looking at, Part 3 opens a finished model, Part 4 runs a small one and changes it five times, and Part 5 builds a model from an empty canvas.
What is in this guide
Section titled “What is in this guide”Part 1. The window, and the few habits that make the rest easy.
Part 2. What a lens is, and how the Software Development lens changes it.
Part 3. Open a finished model and read its answer.
Part 4. The starter model: run it, then change five things and watch each one move a number.
Part 5. Build a model from an empty canvas: five developers, two testers, twenty stories.
Part 6. Reference: the words, the numbers, the mistakes, and where everything lives.
Part 1. The window
Section titled “Part 1. The window”1.1 What ProcessModel is for
Section titled “1.1 What ProcessModel is for”ProcessModel runs a process forward in time and tells you what happened. You draw the steps, say who does them and how long they take, and press a button. The product moves imaginary work through the drawing, minute by minute, and writes a report: how long things took, what waited, how busy people were, what it cost.
Two things follow from that, and they catch out everyone who arrives from a spreadsheet.
The times you type are spreads, not single numbers. Real work takes eight hours sometimes and twenty hours other times, so you type a range, and the product draws a different value each time. That is the point: the answer comes back as a range too.
One run is one possible future. Because of those spreads, running twice gives two answers. Asking for thirty runs and reading the spread is how you get a number you can promise.
Nothing you do here changes the real system, and nothing is sent anywhere. A model is one file on your computer.
1.2 Opening the product
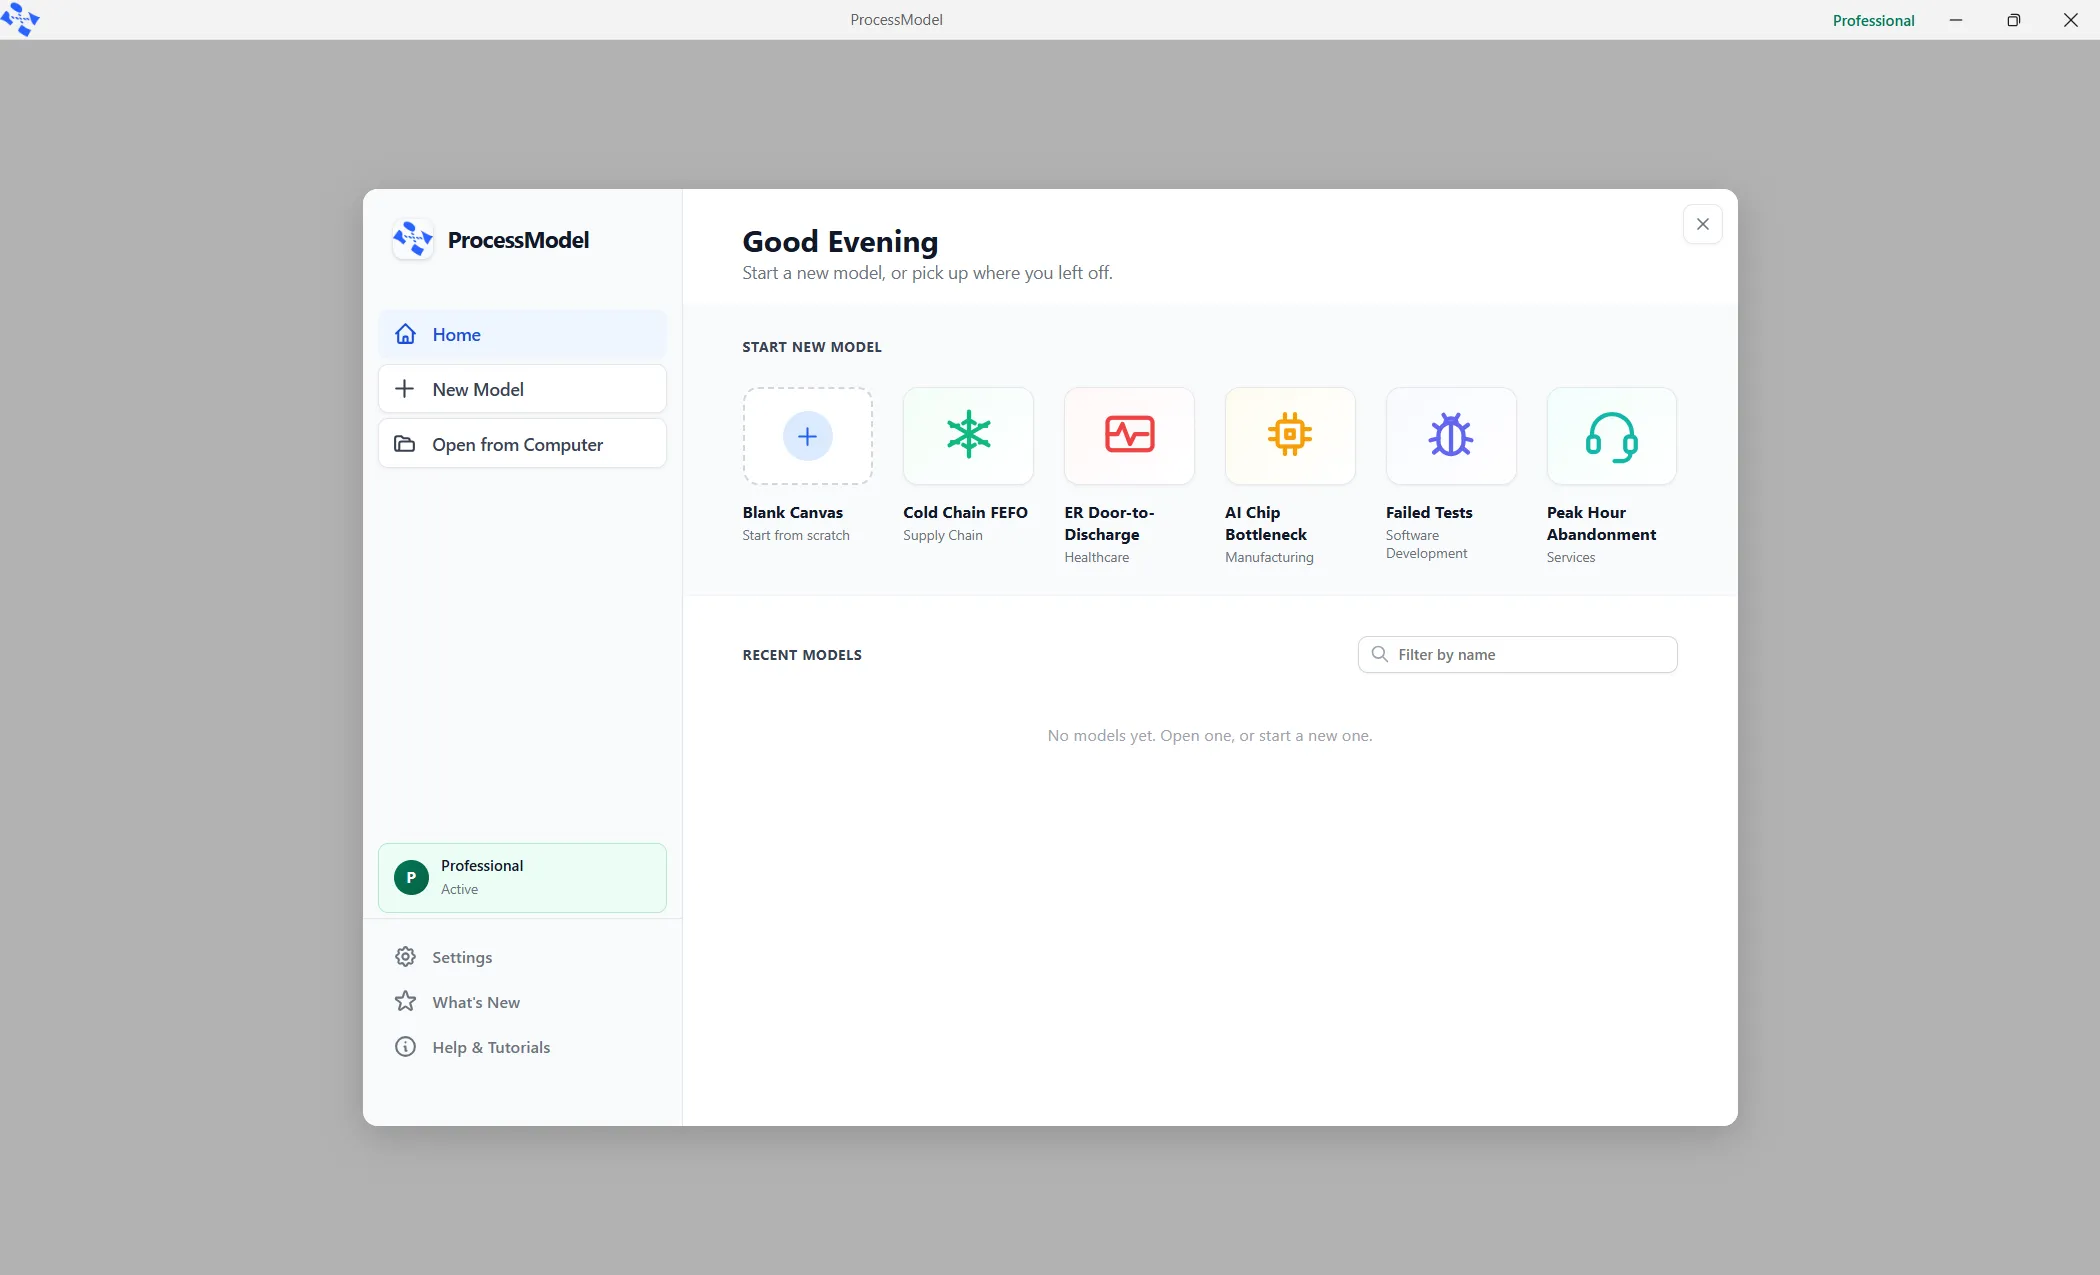
Section titled “1.2 Opening the product”Start ProcessModel. The Welcome screen opens.
Down the left are Home, New Model, and Open from Computer, with Settings, What’s New, and Help & Tutorials at the bottom.
The middle of the Home page has Start New Model with a row of tiles (the first is Blank Canvas), then Recent Models, grouped as Pinned, Today, Earlier this week and Older, with a Filter by name box.
Do not click anything yet. Part 3 opens a finished model first, which is the fastest way to see what the product is for.
1.3 The main window
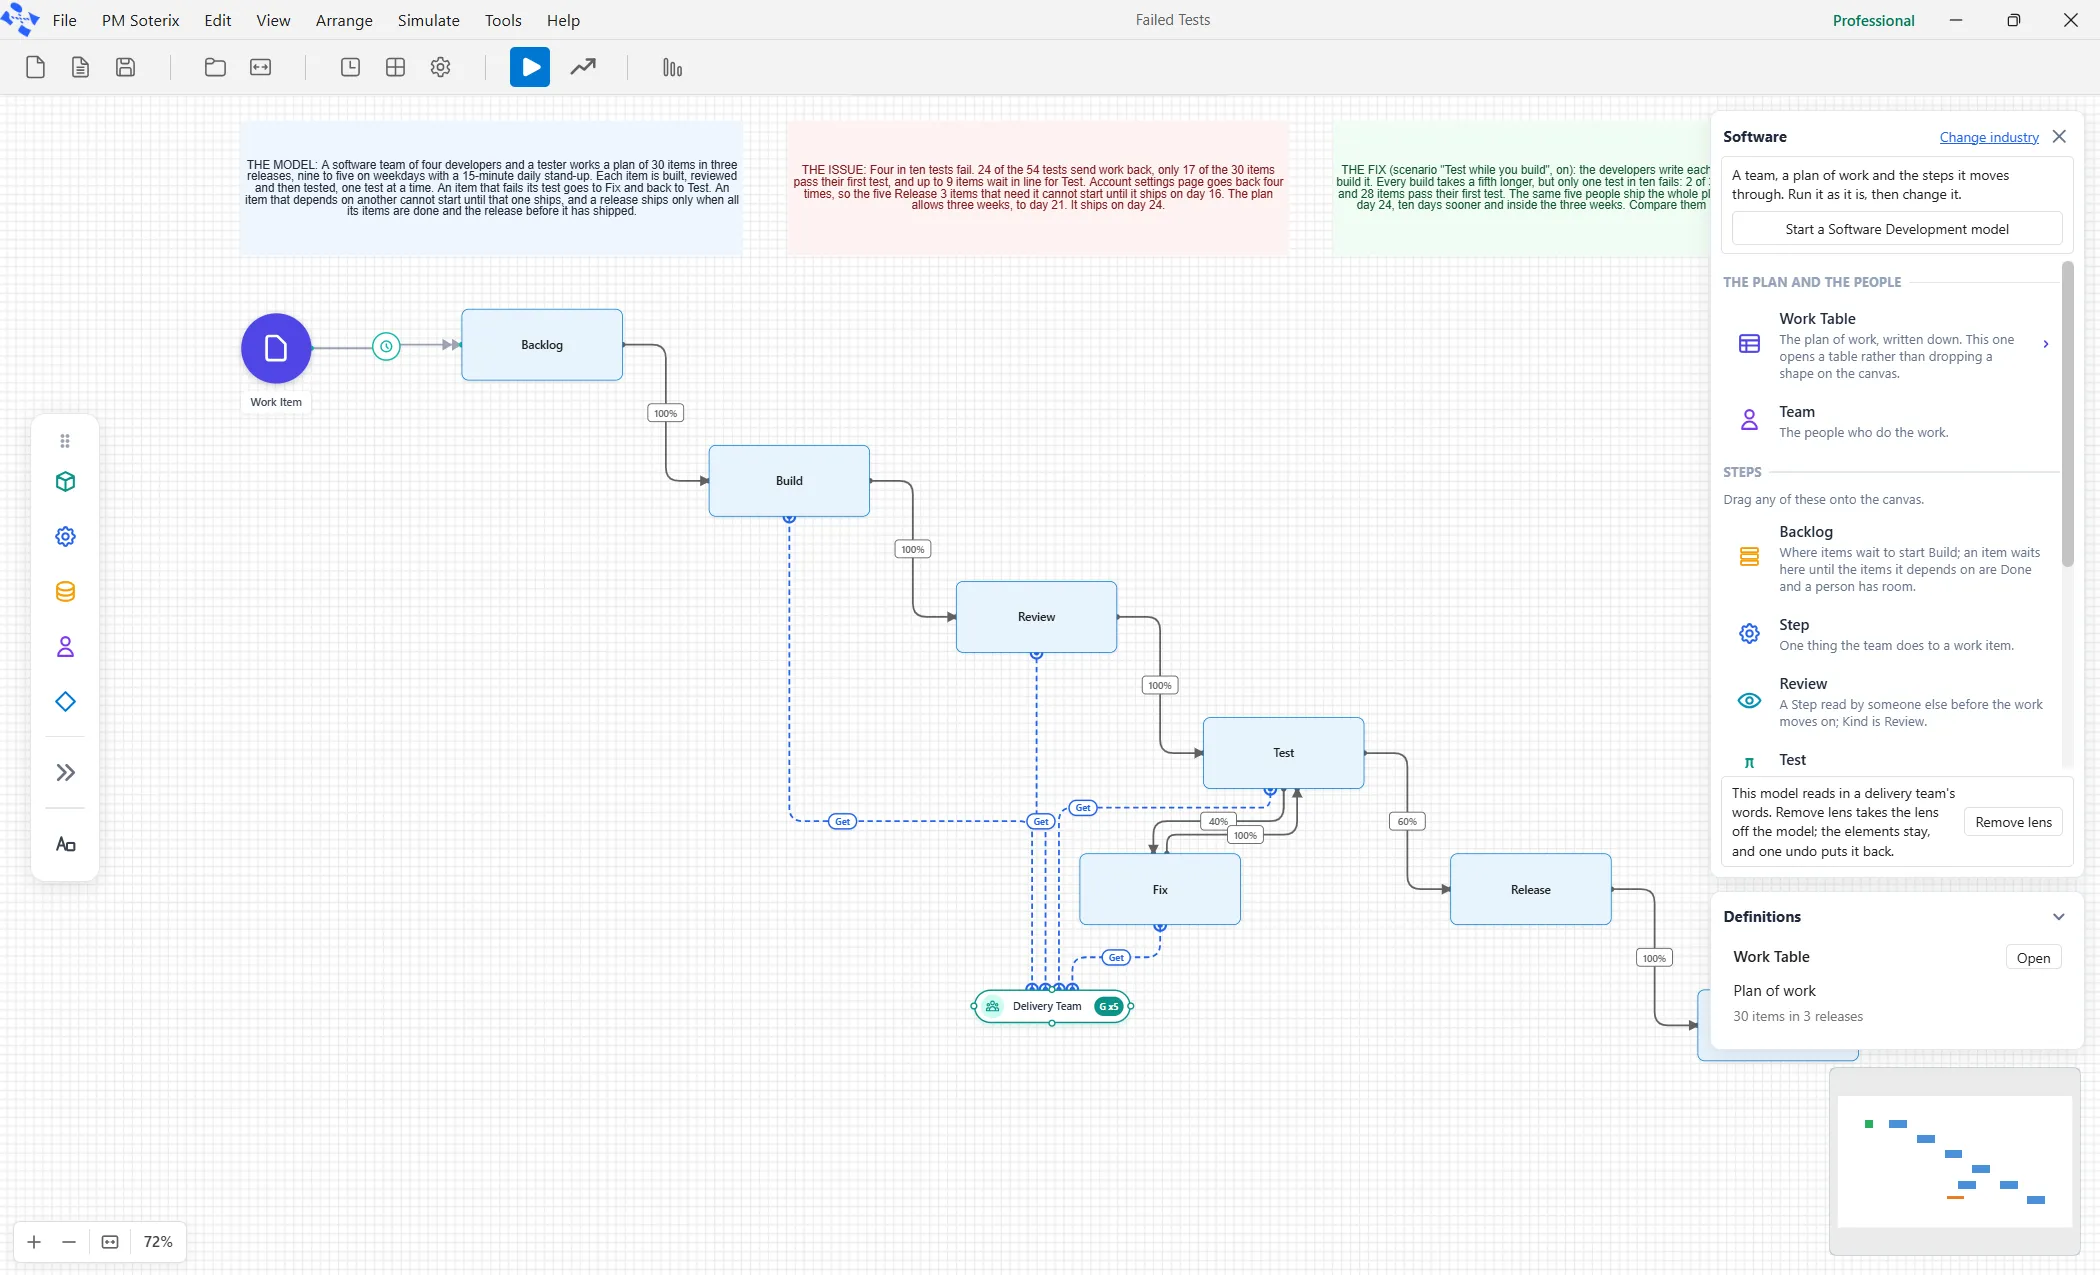
Section titled “1.3 The main window”Once a model is open, you are looking at six things. Find each one before going further.
| What | Where | What it does |
|---|---|---|
| The menus | Along the top: File, PM Soterix, Edit, View, Arrange, Simulate, Tools, Help | Everything in this guide is reached from File, View, Simulate or Tools. |
| The toolbar | Under the menus | Icon buttons. The two that matter are the play button, named Run Simulation, and the bar-chart button, named Output Report. Hover over a button to see its name. |
| The canvas | The large middle area | Where the model is drawn. Drag on empty canvas to pan, use the mouse wheel to zoom, and use View ▸ Fit to View if you lose the drawing. |
| The element toolbar | Down the left of the canvas | The general elements every model is made of. It never changes, whatever kind of model you are building. |
| The properties panel | Appears on the right when you click something | Where you change whatever you clicked. Click empty canvas and it goes away. |
| The industry palette | Appears on the right when you ask for it | A second, optional panel holding one industry’s elements. This is where the Software Development elements live. Part 2 opens it. |
1.4 Four habits
Section titled “1.4 Four habits”Click a thing to edit it. There is no Edit command and no double-click needed. Click an element on the canvas and the properties panel appears on the right. Click an arrow, and you get the arrow’s properties. Click the empty canvas to hide the panel.
The tabs in that panel are icons. They have no words on them. Hover over an icon to see its name. The first is always General.
Change one thing at a time. That is the whole method of this guide. Change one field, run, read one number, write it down. If you make two changes at once, you cannot tell which one moved the answer.
Save early. File ▸ Save As (or Ctrl+Shift+S) asks for a MODEL NAME and a folder and writes one file ending in .pmd. After that, Ctrl+S saves.
Part 2. What a lens is
Section titled “Part 2. What a lens is”2.1 The problem a lens solves
Section titled “2.1 The problem a lens solves”ProcessModel is a general tool. The same six or seven elements model a hospital emergency department, a milk plant, a warehouse, and a software team because, underneath, they share the same few ideas: work arrives, it queues, somebody or something works on it, and it moves on.
That generality is the strength and the obstacle. A delivery team that opens the product sees Entity, Activity, Queue, and Resource, plus a report on throughput time and utilization. None of those are words the team uses. Meanwhile half the toolbar is for things they will never model: tanks, batches, arrivals, and bunches of routings.
2.2 What a lens is
Section titled “2.2 What a lens is”A lens is a setting on one model that makes the product speak one industry’s language. It is stored inside the model file, so a model either wears a lens or it doesn’t, and two models opened side by side can differ. Turning it on changes four things.
| What the lens changes | What you get with the Software Development lens |
|---|---|
| The elements offered | A Software page in the industry palette holds the ten elements a delivery team needs, each with a sentence explaining what it is, and a button that opens a finished starter model, Failed Tests. |
| The words on the fields | A Resource is called a Team, its Quantity is called People, an Activity’s Processing Time is called Effort, and so on. The full list is in Part 6. |
| The report | Five tabs in the team’s language: Forecast, Flow, Team, Quality and Cost. The general report tabs are hidden. |
| The run settings | Replications are called Runs; the run length is also shown in weeks, and two settings appear that only a plan of work needs: Plan date and Working day. |
What a lens does not change is the arithmetic. A Team is still a resource, and a Step is still an activity. The same model with the lens taken off gives the same answer to the last decimal place. The lens changes what you read, never what is computed.
The Software Development lens also brings one thing that is genuinely new rather than renamed: the Work Table, a plan of work written down before the run as a list of items with sizes, dependencies, and releases. Part 4 uses it.
2.3 Opening the Software page
Section titled “2.3 Opening the Software page”Open the View menu and click Show Industry Palette. A panel appears on the right and asks Which industry?, with one card each for Process plant, Software delivery and Healthcare.
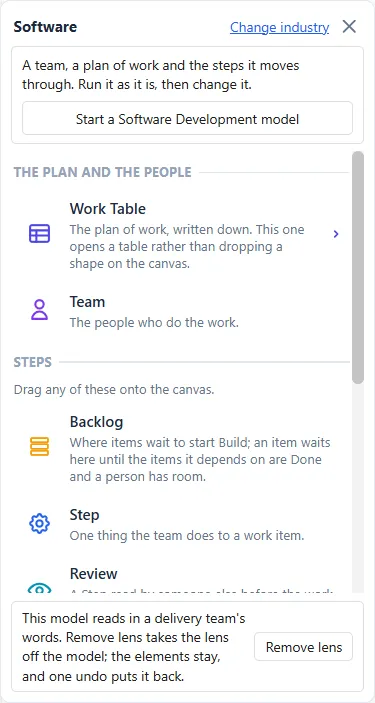
Pick Software delivery. The Software face opens, with a Change industry link in its header and no row of tabs.
Under the header is a button reading Start a Software Development model. Below are the ten elements, each with its name and a sentence. At the very foot of the panel is one quiet row about the lens itself.
View ▸ Show Industry Palette is a toggle, and it remembers. If the panel is already on screen, clicking the menu item closes it.
2.4 The ten elements
Section titled “2.4 The ten elements”These are the only elements a software model needs. Drag nine of them onto the canvas. The first one opens a window instead.
| Element | What it is |
|---|---|
| Work Table | The plan of work, written down. This one opens a table rather than dropping a shape on the canvas. |
| Team | The people who do the work. |
| Backlog | Where items wait to start Build; an item waits here until the items it depends on are Done and a person has room. |
| Step | One thing the team does to a work item. |
| Review | A Step read by someone else before the work moves on; Kind is Review. |
| Test | A Step done by testers; Kind is Test. |
| Pipeline | The automated run the build system does; Kind is Pipeline. |
| Release | Where a release ships; a release waits here until every item in it is done. |
| Freeze | Shuts the Release step for a while, so nothing ships in that window. |
| Done | Where a work item finishes; Kind is Other. |
2.5 Taking the lens off, and putting it back
Section titled “2.5 Taking the lens off, and putting it back”At the foot of the Software page is one row about the lens. What it says depends on the model that is open.
A model that already wears the lens offers Remove lens, and so does an empty canvas that wears it. The elements stay; the words return to the general ones, and the report returns to its general tabs.
A model with general elements and no lens is asked first. Picking Software delivery puts a question at the top of the page: “This model has general elements. Use the software view anyway?” with Use and Not now. Use turns the lens on. After Not now, the foot row offers Use the lens instead, until the canvas is emptied or another model opens. In every other case there is no row.
Use, Use the lens and Remove lens each change the model, and one press of Ctrl+Z undoes it. Nothing is lost either way, because the lens only decides what you read.
Part 3. Open a finished model
Section titled “Part 3. Open a finished model”The fastest way to understand what a software model answers is to read one that is already built. Three ship with the product: two large programs, Three More People and Ten More People, and the small starter model, Failed Tests, that Part 4 runs.
3.1 Finding and opening it
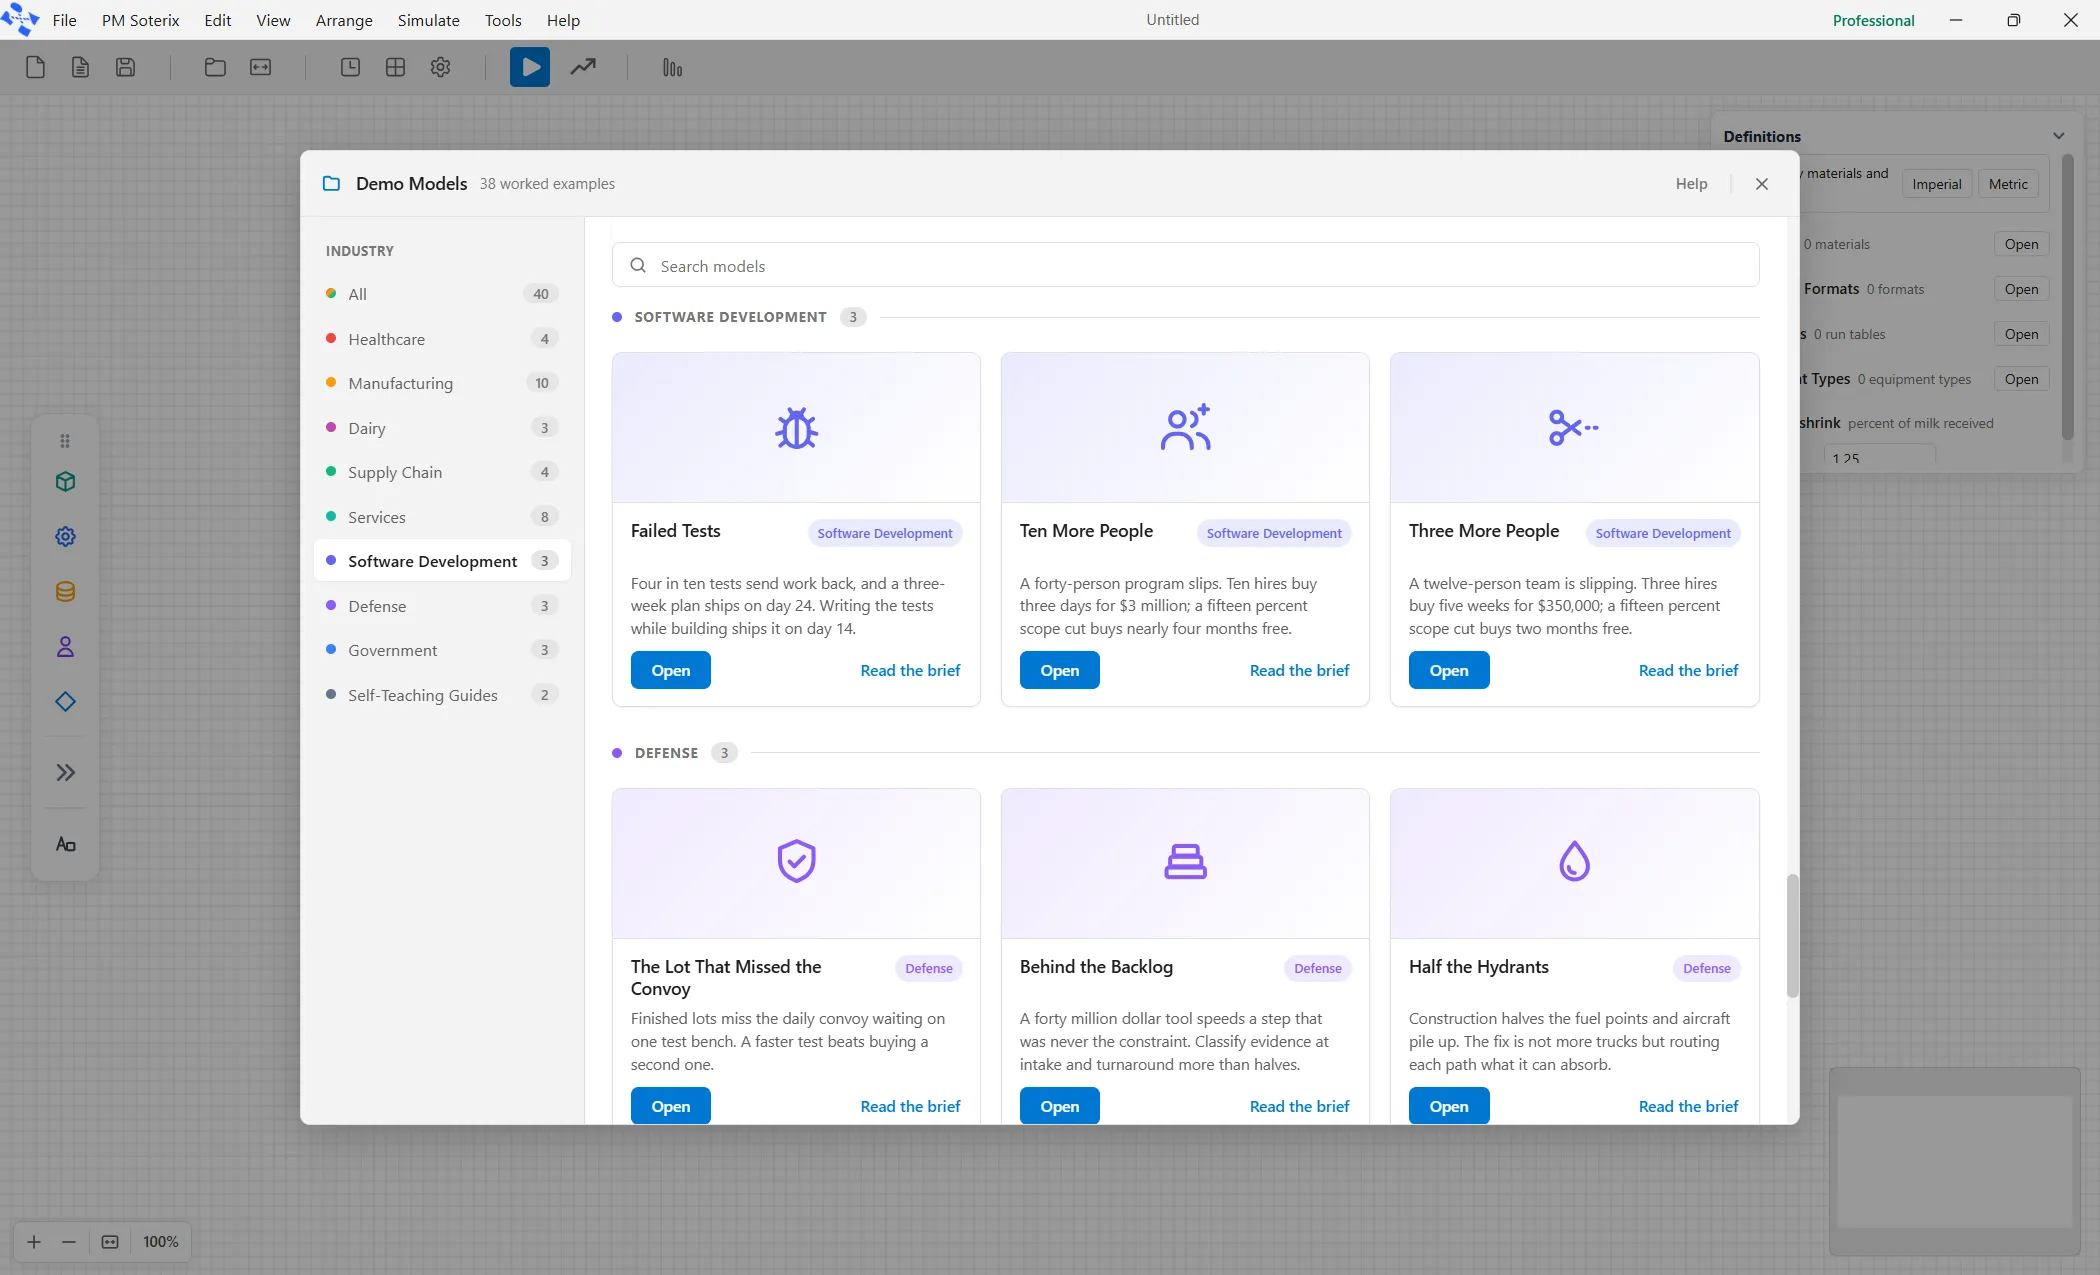
Section titled “3.1 Finding and opening it”Open the File menu and click Demo Models. A window opens titled Demo Models, with the line 38 worked examples beneath it.
Down the left is a list headed Industry: All, Healthcare, Manufacturing, Dairy, Supply Chain, Services, Software Development, Defense, Government, Self-Teaching Guides. Click Software Development. The gallery scrolls to that heading and hides nothing.
Under it are three cards: Failed Tests, Ten More People and Three More People. Each card has an Open button and a Read the brief link.
On Three More People, click Read the brief first. A panel slides in with the case study: the situation, the four choices, the numbers, and what they mean. Read it. When you have finished, either close the panel or press Open this model at its foot.
The model opens on the canvas and the gallery closes.
3.2 What the model says
Section titled “3.2 What the model says”You do not have to run Three More People to learn from it. Its Brief carries the answer, and the model on the canvas shows you what a finished software model looks like: a Backlog, Build, Review, Test, and Release steps, one Delivery Team underneath, and a plan of work with two hundred and twenty items.
The question it answers is the one every late project asks. A twelve-person team is nine months into a nine-month plan and is slipping at month three. There are four choices: do nothing, add three developers now, wish they had been added at month one, or cut the bottom fifteen percent of the scope. The plan says day 273.
| Choice | Finish, most runs by | Against the plan |
|---|---|---|
| Do nothing | day 351 | 78 days late |
| Add three developers at month three | day 315 | 42 days late |
| Add three developers at month one | day 303 | 30 days late |
| Cut fifteen percent of the scope | day 290 | 17 days late |
Three developers hired at month three buy five weeks and cost about three hundred and fifty thousand dollars, because a new person starts at half speed, takes eighty working days to reach full speed, and takes a fifth of an experienced developer while learning. The same three hired at month one buy seven weeks and cost about four hundred and twenty-five thousand dollars. Cutting the scope buys two months and costs nothing extra.
That is what this kind of model is for: not a prettier plan, but a price for each choice in the room.
3.3 If you do run it
Section titled “3.3 If you do run it”Press the play button on the toolbar, named Run Simulation. Expect about two and a half minutes for this model. A dialog reads Simulation Complete and asks Would you like to view the results? Click Yes, and the report opens. Part 4 explains every tab.
Part 4. The starter model and five changes
Section titled “Part 4. The starter model and five changes”This part is the heart of the guide. You will build nothing: the product ships a small, complete software model, and you will run it and then change five single fields, watching each one move a number in the report. By the end, you will know what every tab is for.
4.1 Start it
Section titled “4.1 Start it”If a model is open and you want to keep it, save it first. File ▸ New gives you an empty canvas.
Open View ▸ Show Industry Palette and pick Software delivery, as in Part 2.
Press Start a Software Development model. Its hover text reads Opens the Failed Tests demo model, and that is what it does: it opens the bundled demo Failed Tests as a new, unsaved model in place of the one that is open, and builds nothing. It asks first only when the open model has unsaved changes, and there is no Ctrl+Z to bring the old model back, so save anything you want to keep before you press it.
Seven steps appear, stepping down the canvas from top left to bottom right, with Fix below the line between Review and Test, and a Delivery Team underneath with dashed lines rising from it to four of the steps.
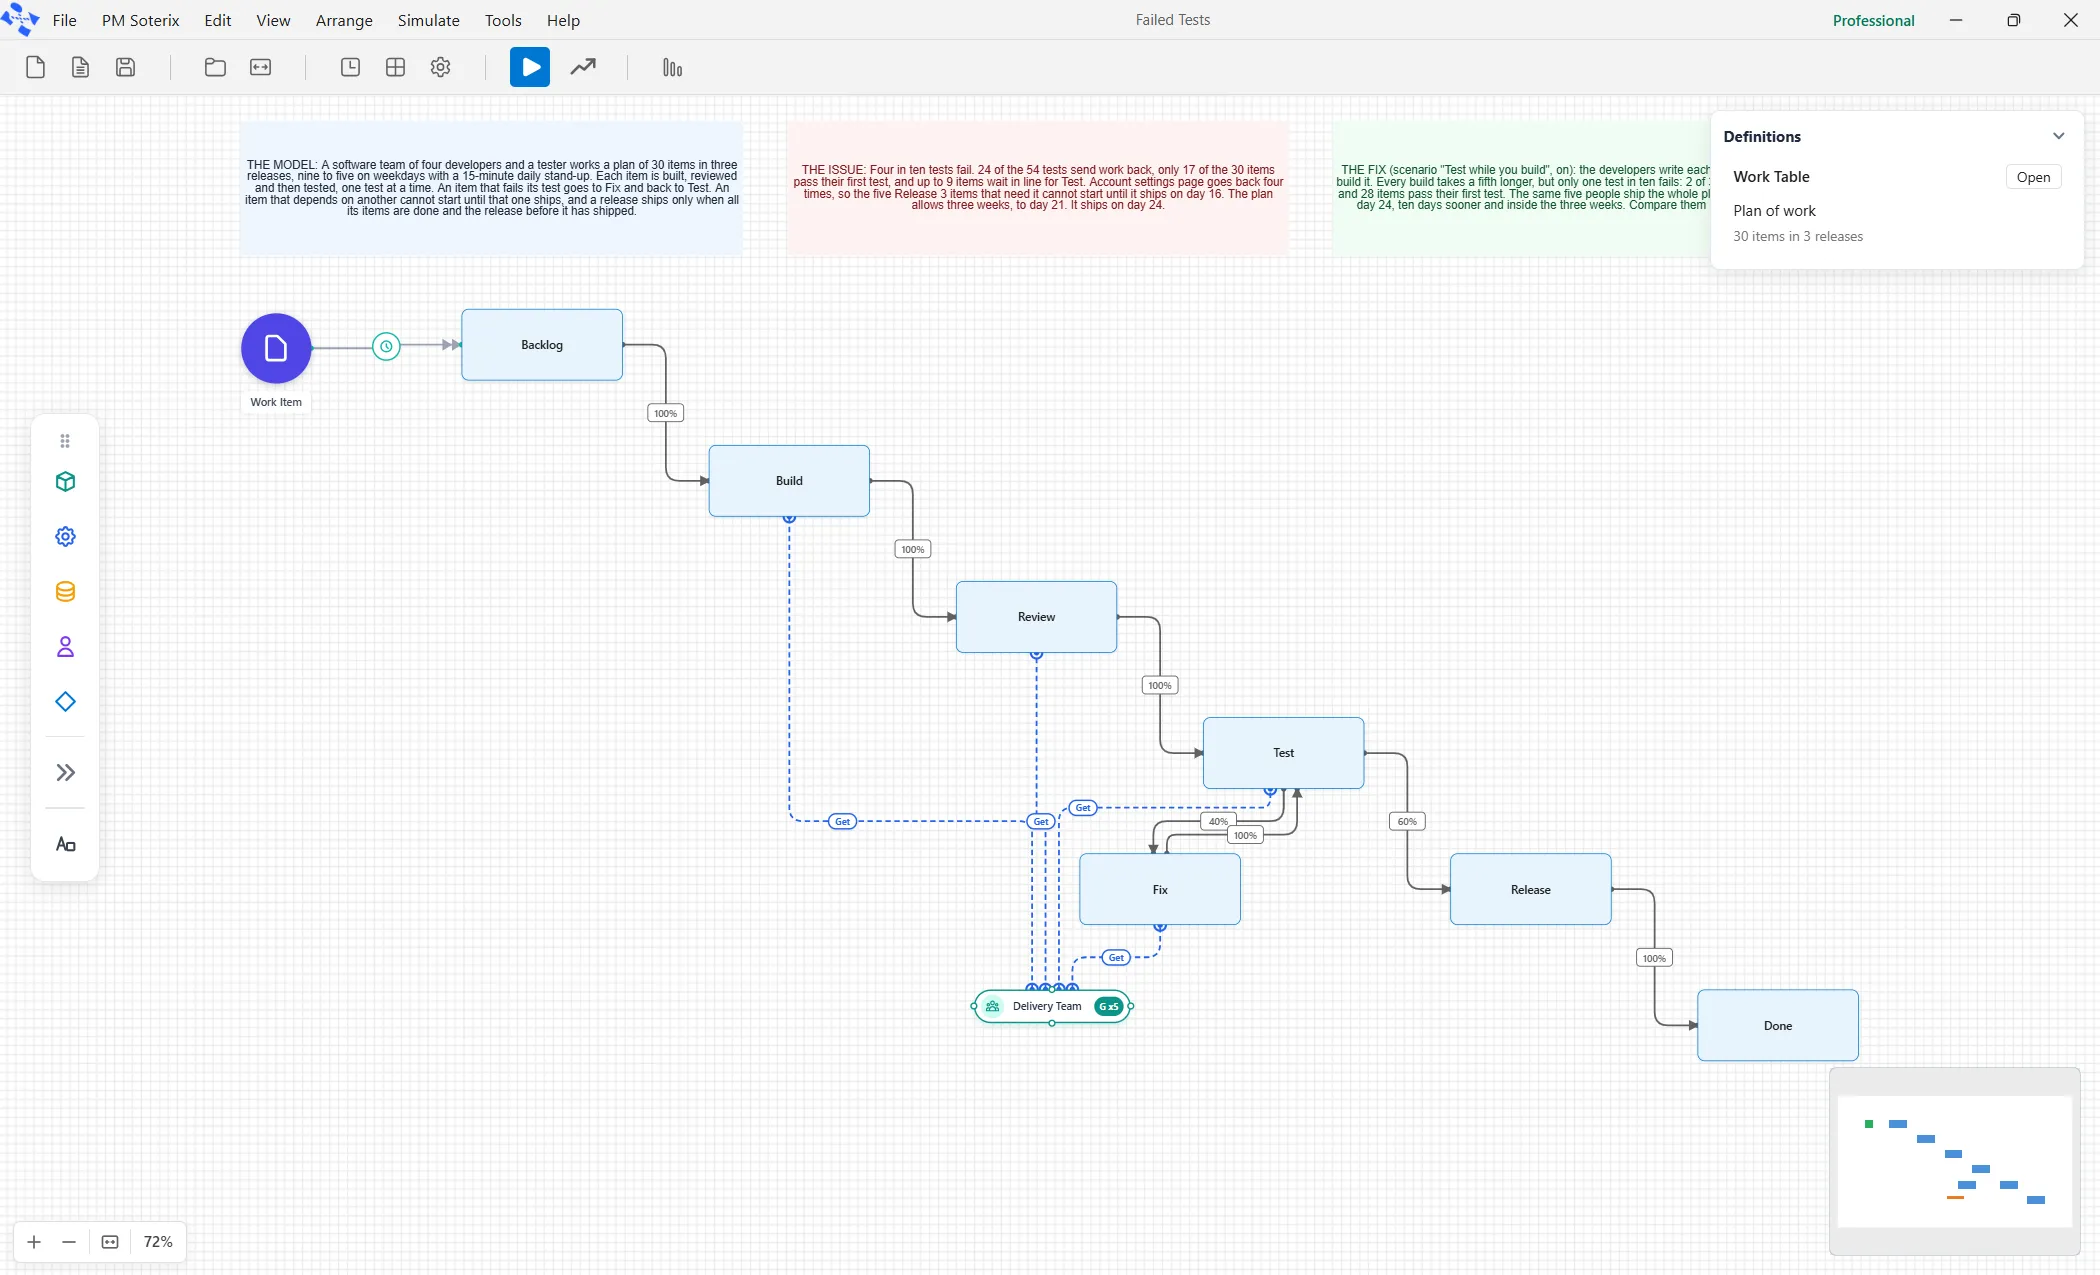
4.2 What you are looking at
Section titled “4.2 What you are looking at”Click each element once and read its properties on the right. This is the whole model.
| On the canvas | What it is | What it is set to |
|---|---|---|
| Work Item | The kind of work. Every row of the plan becomes one of these when the run starts. | Nothing to set. |
| Backlog | Where an item waits for what it depends on, and for a person with room. | Kind of step: Backlog. No effort. |
| Build | Where the item’s hours are spent. | Kind of step: Build. Effort is the item’s own size. Four people can be on it at once. |
| Review | Someone reads the work before it moves on. | Kind of step: Review. Effort: 1 hour. Two at once. |
| Test | A tester checks it. Six in ten items go on to Release; four in ten go to Fix. | Kind of step: Test. Effort: 2 hours. One at a time. |
| Fix | An item that failed its test is reworked here, then goes back to Test. | Kind of step: Build. Effort: four tenths of the item’s own size. Four people can be on it at once. |
| Release | A release ships when every item in it is done. | Kind of step: Release. No effort. |
| Done | Where an item finishes and is counted. | Kind of step: Other. |
| Delivery Team | The people. Four developers and one tester. | Works a weekday office day. A fifteen-minute stand-up every day takes the whole team. |
The arrow from Work Item into Backlog is the arrival: it is the one place the plan of work is read. Click it and the properties panel shows Work Table as its kind.
The plan of work
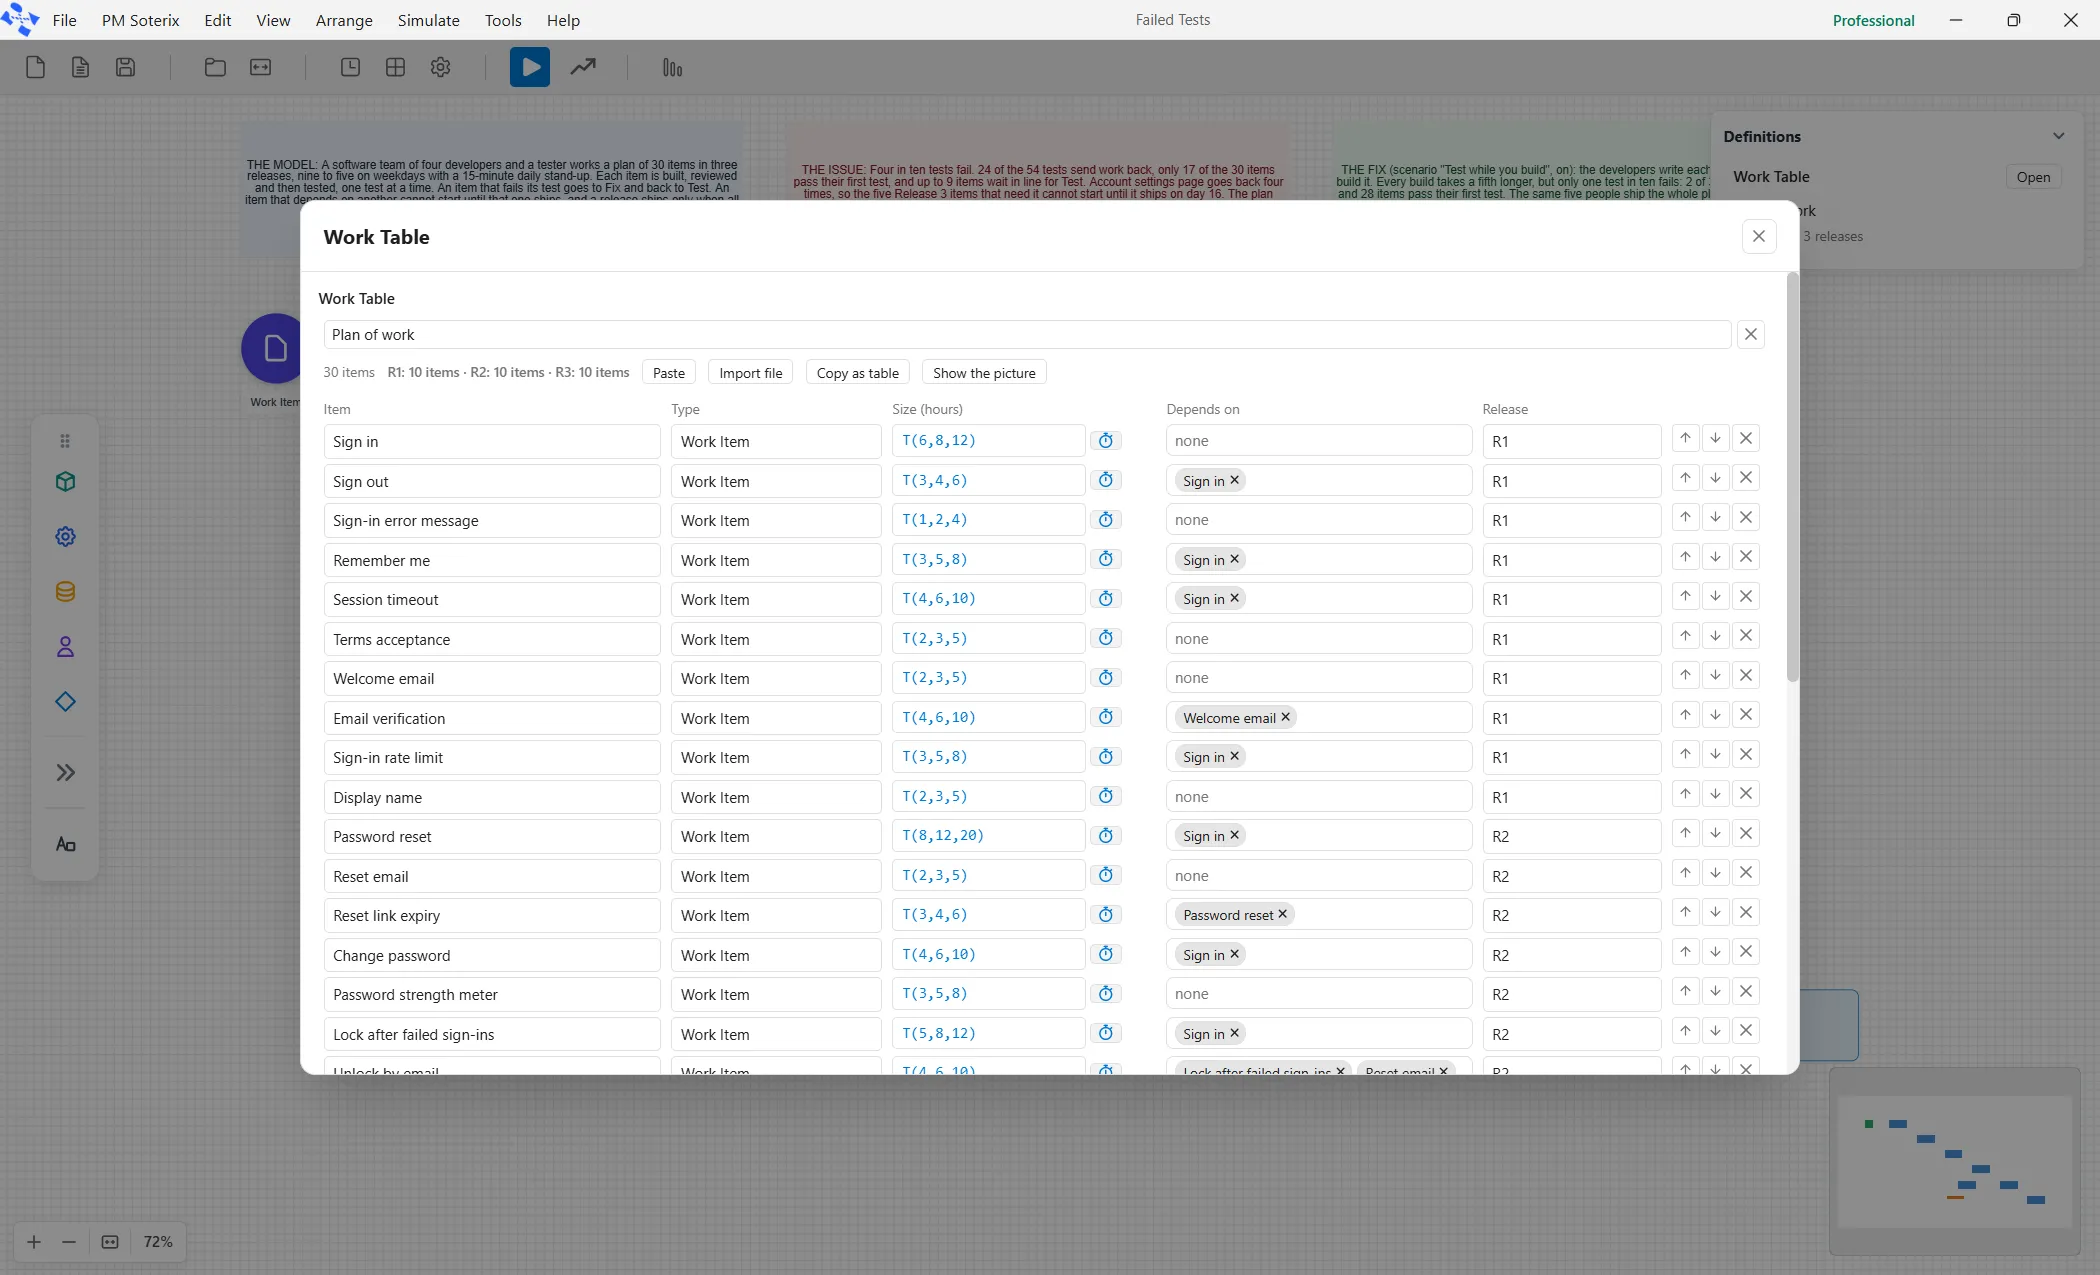
Section titled “The plan of work”Click the Work Table tile at the top of the Software page. A window opens, titled Work Table. It holds thirty rows and five columns, in three releases of ten: R1, R2 and R3. The first rows read:
| Item | Type | Size (hours) | Depends on | Release |
|---|---|---|---|---|
| Sign in | Work Item | T(6,8,12) | R1 | |
| Sign out | Work Item | T(3,4,6) | Sign in | R1 |
| Sign-in error message | Work Item | T(1,2,4) | R1 | |
| Remember me | Work Item | T(3,5,8) | Sign in | R1 |
| Session timeout | Work Item | T(4,6,10) | Sign in | R1 |
Further down is Password reset, the row the changes below use: T(8,12,20), depends on Sign in, release R2.
T(6,8,12) means: at least six hours, most likely eight, at most twelve. Each run draws a different number from that shape. That single convention is why the answer is a range. Row order is priority: the team works down the list.
The window has no OK and no Cancel. Every keystroke is already in the model. If you make changes Ctrl+Z undoes it. Close it with the ✕ or the Escape key.
4.3 Run it
Section titled “4.3 Run it”Press the play button on the toolbar, named Run Simulation (or Simulate ▸ Run Simulation, or Ctrl+R). The run plays out on the canvas.
A dialog headed Simulation Complete names the day the plan of work finished, and asks Would you like to view the results? Click Yes.
The Output Report window opens. Across the top are five questions, numbered 1 to 5, and it opens on the second: How is it doing? Underneath that row are the lens’s own tabs: Forecast, Flow, Team and Quality. A fifth, Cost, joins them once a team carries a pay rate, which the Delivery Team in this model does. Those tabs, and no general ones, are what the lens shows.
You can reopen this report at any time from Tools ▸ Output Report (Ctrl+Shift+R) or the bar-chart button on the toolbar. Escape closes it.
Read the Forecast tab
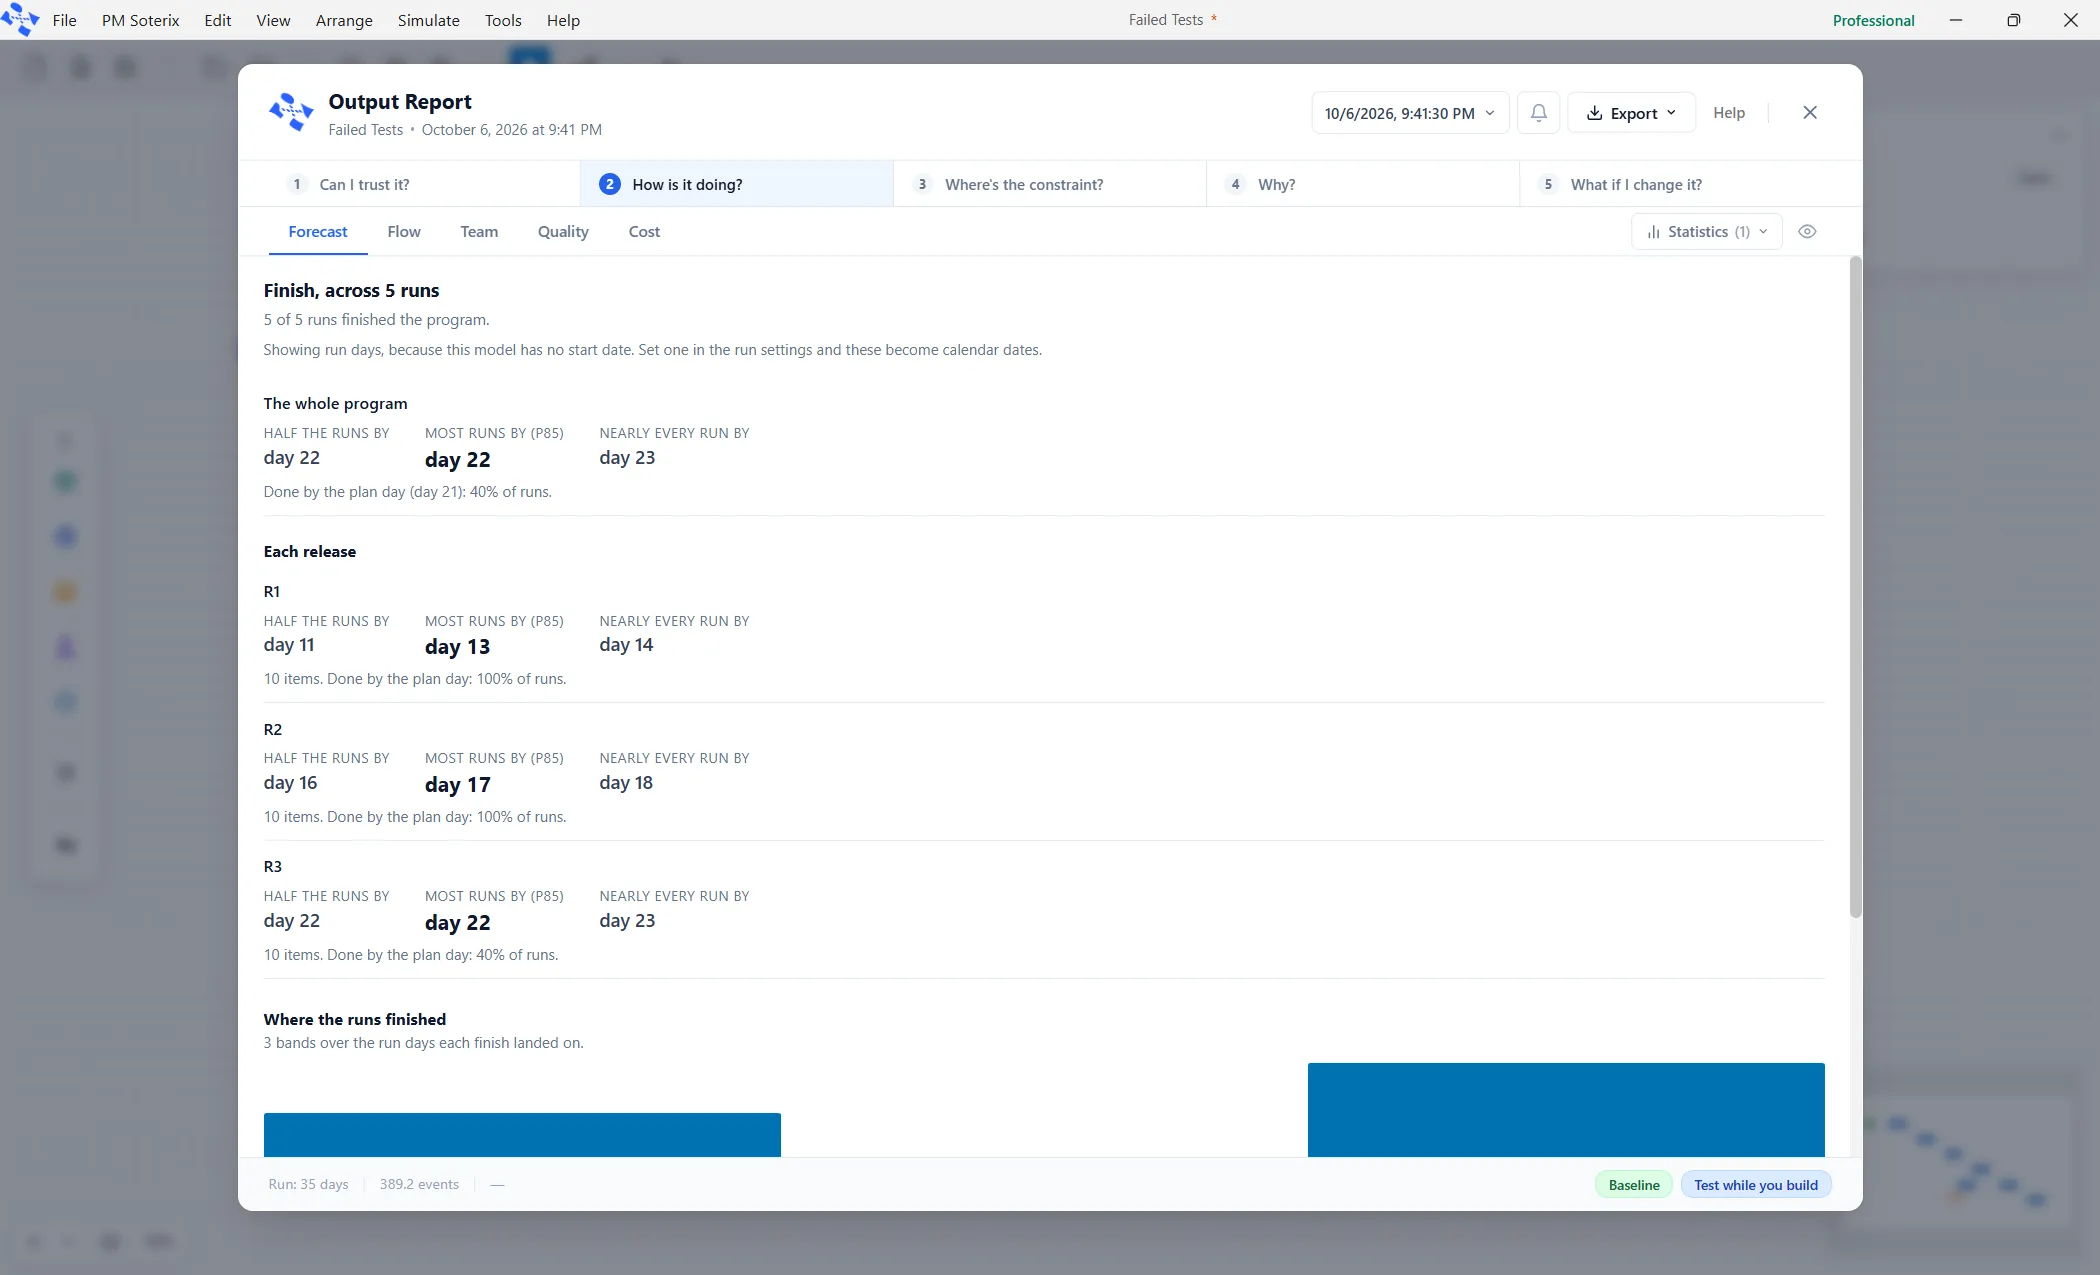
Section titled “Read the Forecast tab”It opens on Forecast. At the top it says Finish, from one run, and the line under it reads One run, so this is a single date, not a range. Raise Runs in the run settings to see the spread. Below are two blocks.
The whole program, with three readings: Half the runs by, Most runs by (P85) and Nearly every run by. With one run all three read the same day. Under them a line reads Done by the plan day (day 21), with the share of runs that made it. The brief behind the card puts this plan’s finish at day 24, three days past the plan date.
Each release. R1, R2 and R3 each get the same three readings, and a line giving the items they hold and whether they were done by the plan day.
There is no chart yet. Where the runs finished needs more than one run.
Two things to take from that. The tab prints whole days, so day 24 means partway through day twenty-four. And the three readings are the same because one run has one finish. Change 1 is what separates them.
Read the Flow tab
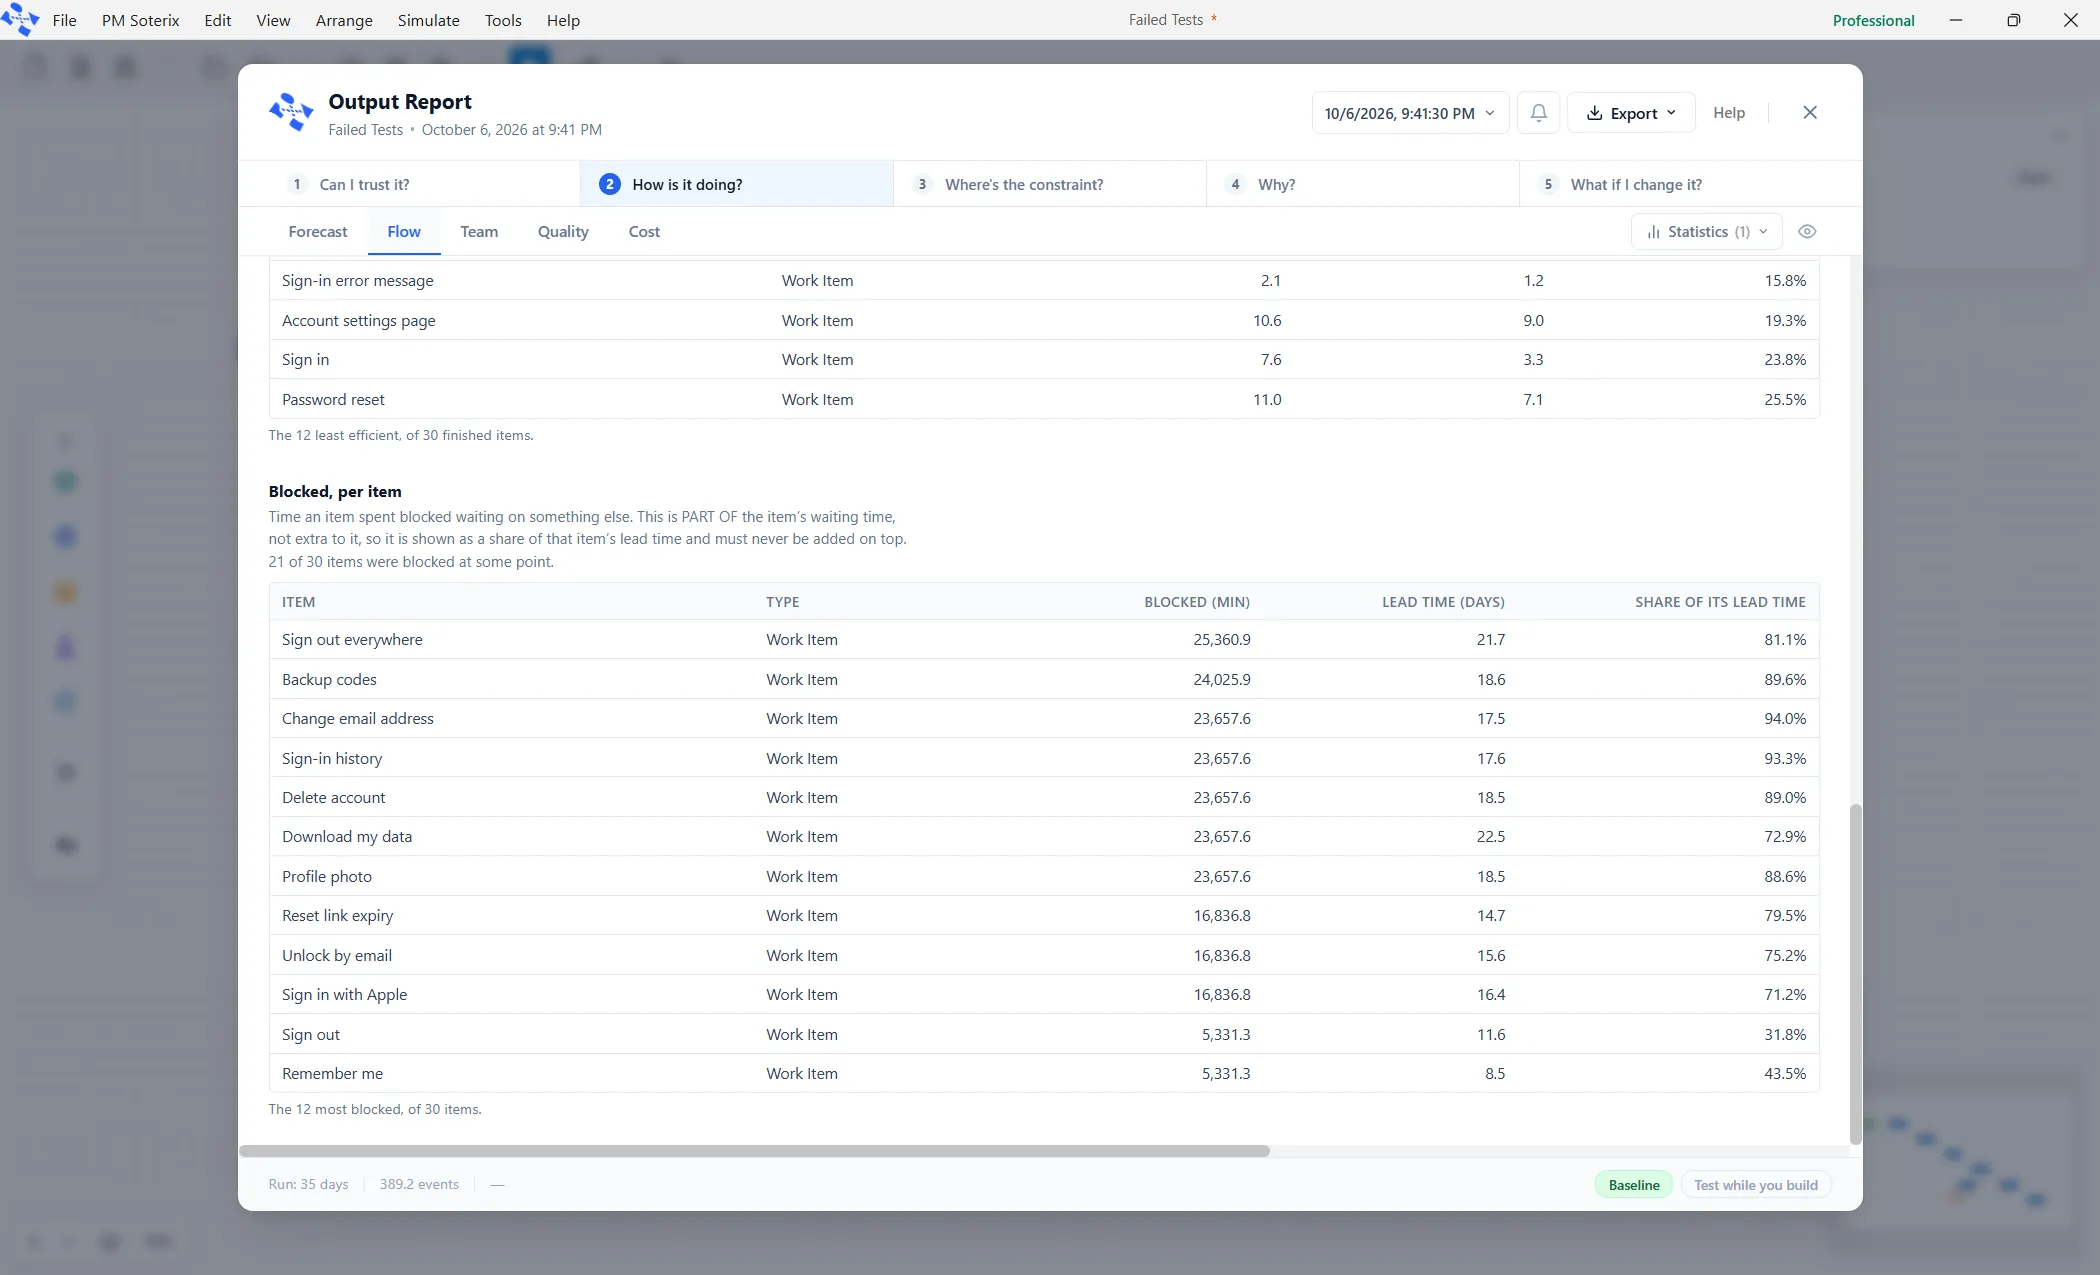
Section titled “Read the Flow tab”Click Flow. The top is a table with one row per work item type. Below it are five sections that appear only when the model has a plan of work. The two to look at now are the last two.
Flow efficiency lists each item with its Hours of work, the Days, Build to Done it took, and an Efficiency percentage: how much of the time between starting and finishing anyone was actually working on it.
Blocked, per item, lists what waited and for how long. Sign out and Password reset each show a Blocked (min) figure, because both wait for Sign in, as does every other item that depends on it. An item that depends on nothing shows nothing.
That is the Backlog doing its job: an item that depends on another does not start until that other one is Done.
4.4 The five changes
Section titled “4.4 The five changes”Each change below is one field. After each one, run again and check the named place. Keep the change unless the step says to put it back.
Change 1. Ask for thirty runs instead of one
Section titled “Change 1. Ask for thirty runs instead of one”Open Simulate ▸ Options (Ctrl+Shift+O). A window opens titled Simulation options, with six groups down a rail on its left: Run, Clock and calendar, Animation, Units, Display and Advanced. It opens on Run.
The first field is Run length, set to 35, with Min / Hr / Day beside it and Day chosen. Leave it. The plan finishes in days; the window is wide so that a bigger plan typed into this model still finishes inside it.
Below it is Runs, set to 1. Change it to 30.
Press Apply at the bottom right. (There is no OK. Apply closes the window and keeps the change. If something is changed and you press Cancel, the ✕ or Escape, the window asks Apply changes to Simulation options? and offers Apply, Discard and Keep editing.)
Press Run Simulation again, then Yes.
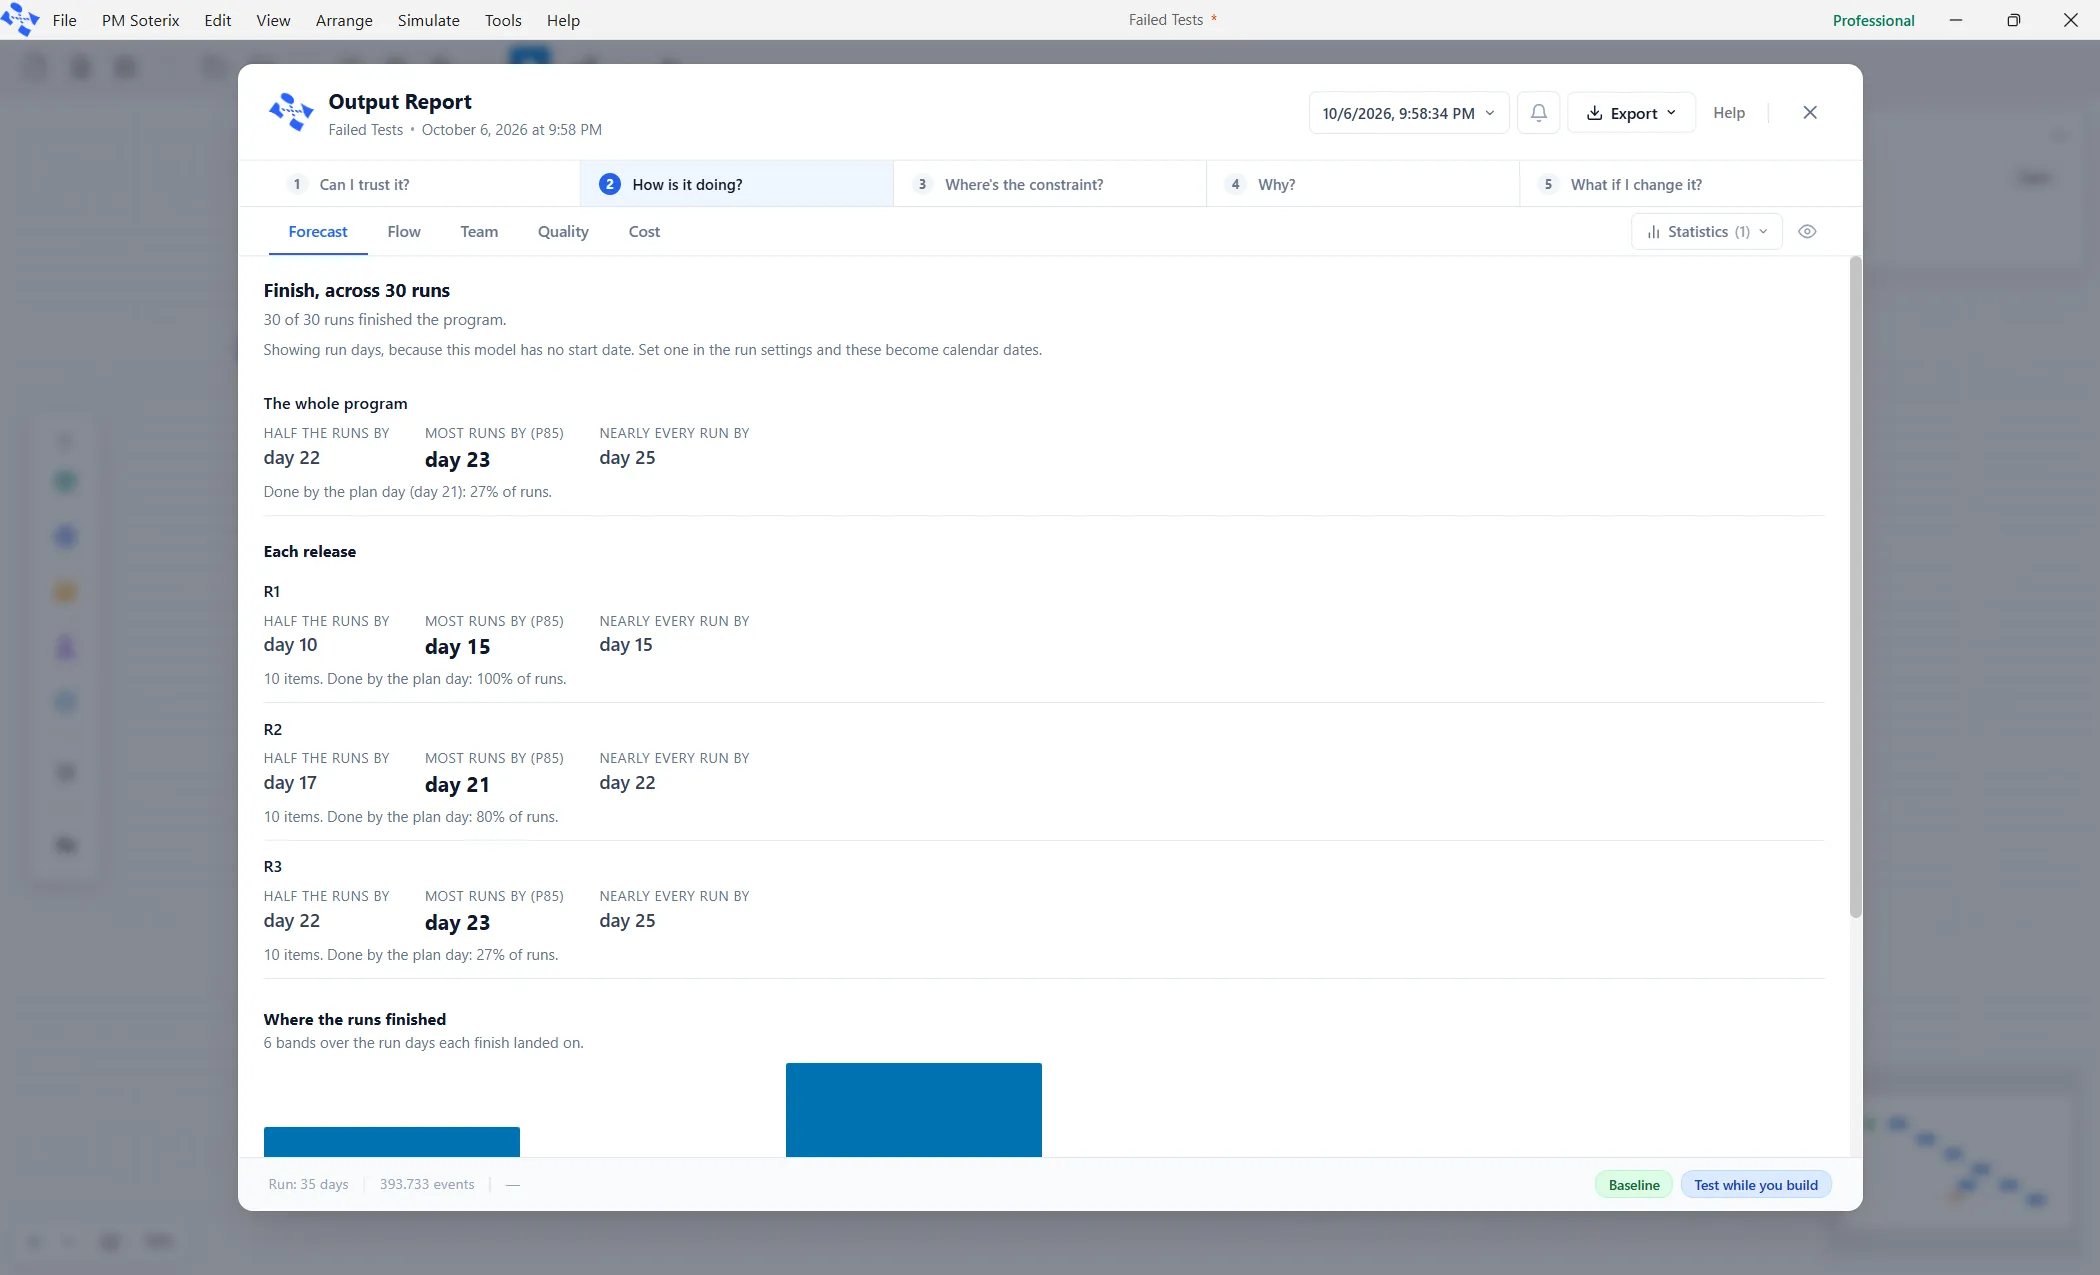
Where to see it. The Forecast tab. Its heading now reads Finish, across 30 runs, the line under it counts how many of the 30 finished the program, the three readings for the whole program are now a range, and a chart headed Where the runs finished appears.
What it teaches. One run gave one date, and it is only one possible future. Thirty runs give a range, and the bad days show up in it. A handful of runs find the answer; more runs find the bad days. The middle reading is the one to give anybody who asks. From here on, leave Runs at 30.
Change 2. Make one estimate more certain
Section titled “Change 2. Make one estimate more certain”The plan says Password reset is between 8 and 20 hours, most likely 12. Suppose the team investigates and is now sure it is about 12.
Open the Work Table window (the tile at the top of the Software page).
In the Password reset row, click the Size (hours) cell and replace T(8,12,20) with T(11,12,13).
Close the window with Escape and run again.
Where to see it. The Forecast tab, the whole program row and the R2 row. Compare Most runs by (P85) with the run before.
What it teaches. The most likely size did not change. What changed is how badly the estimate could be wrong, and that alone can narrow the range of dates the Forecast gives. The spread in your estimates, not only the speed of your people, is what pushes out the date you can commit to.
Put it back to T(8,12,20) before the next change.
Change 3. Remove a dependency
Section titled “Change 3. Remove a dependency”Open the Work Table window again.
In the Password reset row, clear the Depends on cell so that it no longer names Sign in.
Close the window and run again.
Where to see it. Two places. On Flow, in the Blocked, per item section, the Password reset row’s Blocked (min) drops to nothing, while Sign out still waits. On Forecast, compare the R2 row and the whole program with the run before.
What it teaches. A dependency costs time as surely as a shortage of people does. Before this change Password reset could not start until Sign in was Done, and now it can start at once. Before hiring, look at the Blocked column.
Put the dependency back (choose Sign in in the Depends on cell) before the next change.
Change 4. Make the stand-up longer
Section titled “Change 4. Make the stand-up longer”This one needs a tab that is hidden until you ask for it, which is worth learning once.
Click the Delivery Team on the canvas. The properties panel appears on the right, with a column of tab icons.
Point at the eye icon at the bottom of that column (its name is Manage visible tabs) to open the Visible Tabs list, then click the People row. Each tab in the list is a row with an eye icon, and clicking the row switches that tab on or off. People is now a tab in the row, and it stays for every team from now on.
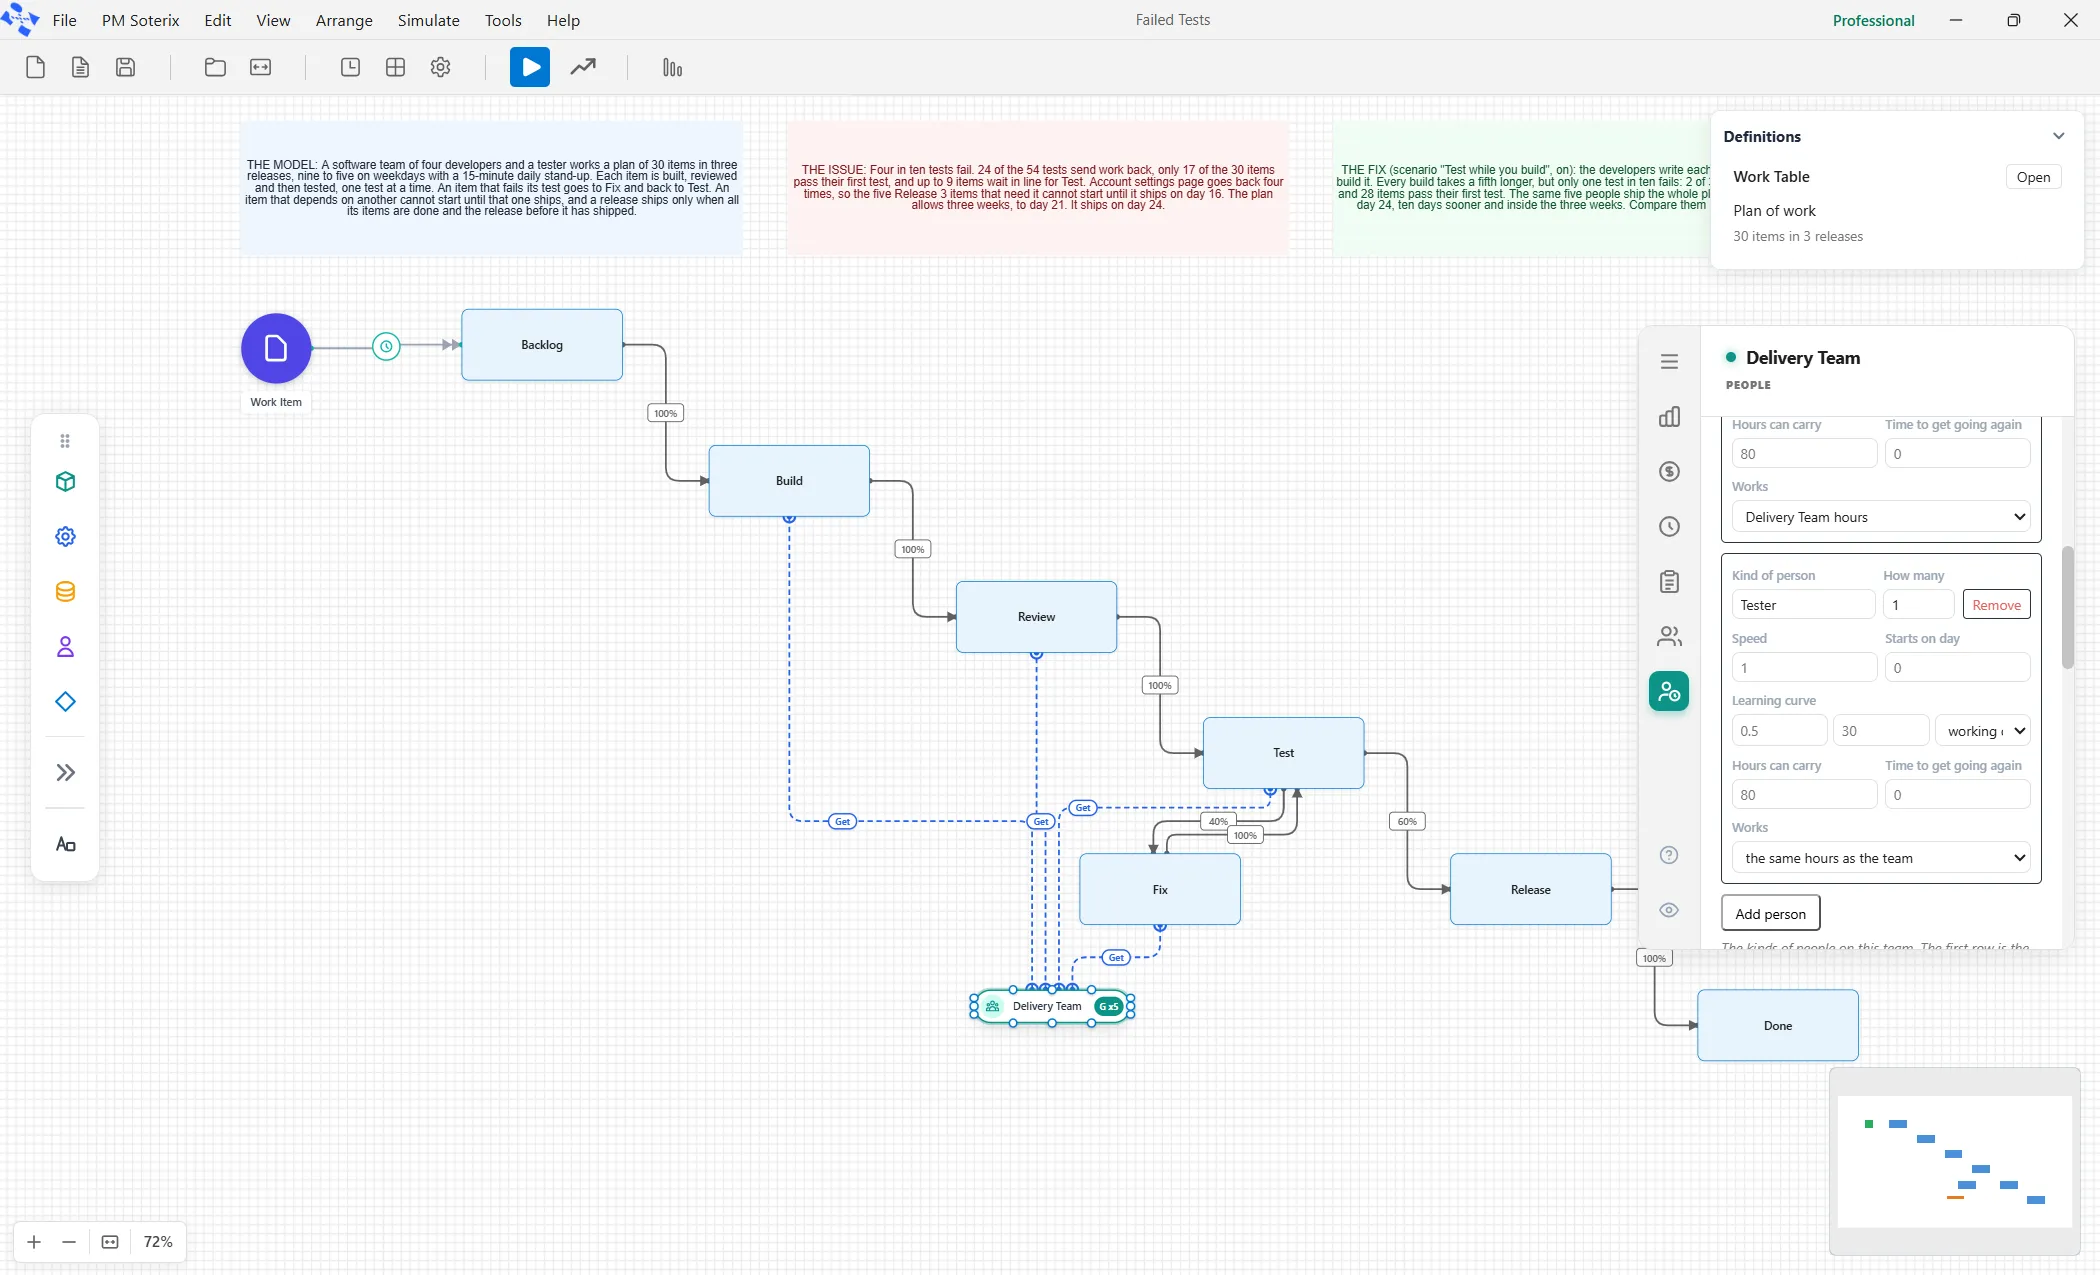
Open the People tab. Below the People table is a table headed Interruptions. Its first row is greyed and named Interruptions; that is the team’s own availability, and it carries a note pointing at the Availability tab, so leave it. The row beneath it is the Stand-up. Its Time Between Interruptions is 1440 and its Interruption Time is 15, both in minutes, with a Min button beside each (1440 minutes is one day). Change the Stand-up’s Interruption Time to 90.
Click the empty canvas to put the panel away, and run again.
Where to see it. The Forecast tab, the whole program row. The readings move later than in the run before, because the whole team gives up more of every day.
What it teaches. Meetings are hours of work like any other. A daily stand-up that grows from fifteen minutes to an hour and a half takes a real bite out of every working day, and it pushes the day the typical run finishes out. Push it much further and the team can no longer clear the plan inside the run window at all, and the Forecast stops giving a date and reads not reached. The cost of a meeting is the work that did not get done.
Put the Stand-up’s Interruption Time back to 15 before the last change.
Change 5. Change the size of the team twice
Section titled “Change 5. Change the size of the team twice”This one has three runs, and the answer is the most useful thing in this guide.
Click the Delivery Team and open the People tab again. The People table at the top of it has one row for the team itself, with How many set to 4, and a second row for the Tester.
Set the first row’s How many to 8. Run, and read the Forecast.
Now set it to 1. Run, and read the Forecast again.
Where to see it. The Forecast tab, the whole program row, for the three team sizes: 4, 8 and 1. Put the three side by side.
Is the date moving in proportion to the team? Look at where the work waits. One step in this plan has a single person on it: Test, where the tester tests one item at a time, and the brief behind the card says the line forms there. More developers send items to that line faster, and fewer slow them down. Neither changes how fast one tester tests, and the Blocked, per item section of the Flow tab shows the rest: an item waiting for another item does not start sooner because there are more people to start it.
Now try the number that limits a step. Put How many back to 4. Click the Build step and look at its General tab: there is a row of three small boxes, and the middle one is labeled People (hover over it and it says People who can work this step at once). It is set to 4. Change it to 1 and run.
Where to see it. The Forecast tab. With only one person allowed on Build at a time, the readings move later than in the run at 4.
What it teaches. There are two different numbers called People, and they mean different things. On a Team, it is how many people exist. On a Step, it is how many of them may be on that step at once. Adding people to a plan that cannot use them is the most common mistake in resourcing a project, and the runs above let you check it on a plan of your own.
Put the Build step’s People box back to 4.
4.5 The other three tabs
Section titled “4.5 The other three tabs”You have used Forecast, Flow and Team. The other two are worth one look each.
Quality is headed Checking, rework and what never shipped. Three cards count the items that went through a Review, Test or Pipeline step, the ones that came back for rework, and the ones that never shipped. Under them, By the kind of step groups the work by what kind of step did it. The starter model has a rework route, Test back to Fix, so the middle card gives a count and the share of checked items that went back to a Build step. A model with no such route reads No fix route, which is a true answer, not a blank.
Cost is the general cost report under a new name. It is not even on the tab row until a team carries an hourly rate, which the Delivery Team in the starter model does.
4.6 Save it
Section titled “4.6 Save it”File ▸ Save As, type a MODEL NAME, choose a folder, and press Save Model. The file ends in .pmd and holds the model, the plan of work, the lens, and the run settings. Opening it later gives you exactly this.
Part 5. Build a model from an empty canvas
Section titled “Part 5. Build a model from an empty canvas”This part builds a model of a real team: five developers, two testers, and twenty stories in two releases. Nothing is inherited from the starter model. Follow it in order, because a few steps depend on the one before.
Allow an hour. Save as you go.
5.1 Start with an empty canvas and the Software page
Section titled “5.1 Start with an empty canvas and the Software page”Open File ▸ New (Ctrl+N). An empty canvas.
Open View ▸ Show Industry Palette and pick Software delivery.
Do not press Start a Software Development model this time; that opens the finished Failed Tests model, which is Part 4. Note that the lens row at the foot of the page already reads Remove lens: picking Software delivery on an empty canvas turned the software view on at once.
The page has two groups: THE PLAN AND THE PEOPLE at the top, and STEPS below it, under the line Drag any of these onto the canvas.
5.2 Put the steps on the canvas
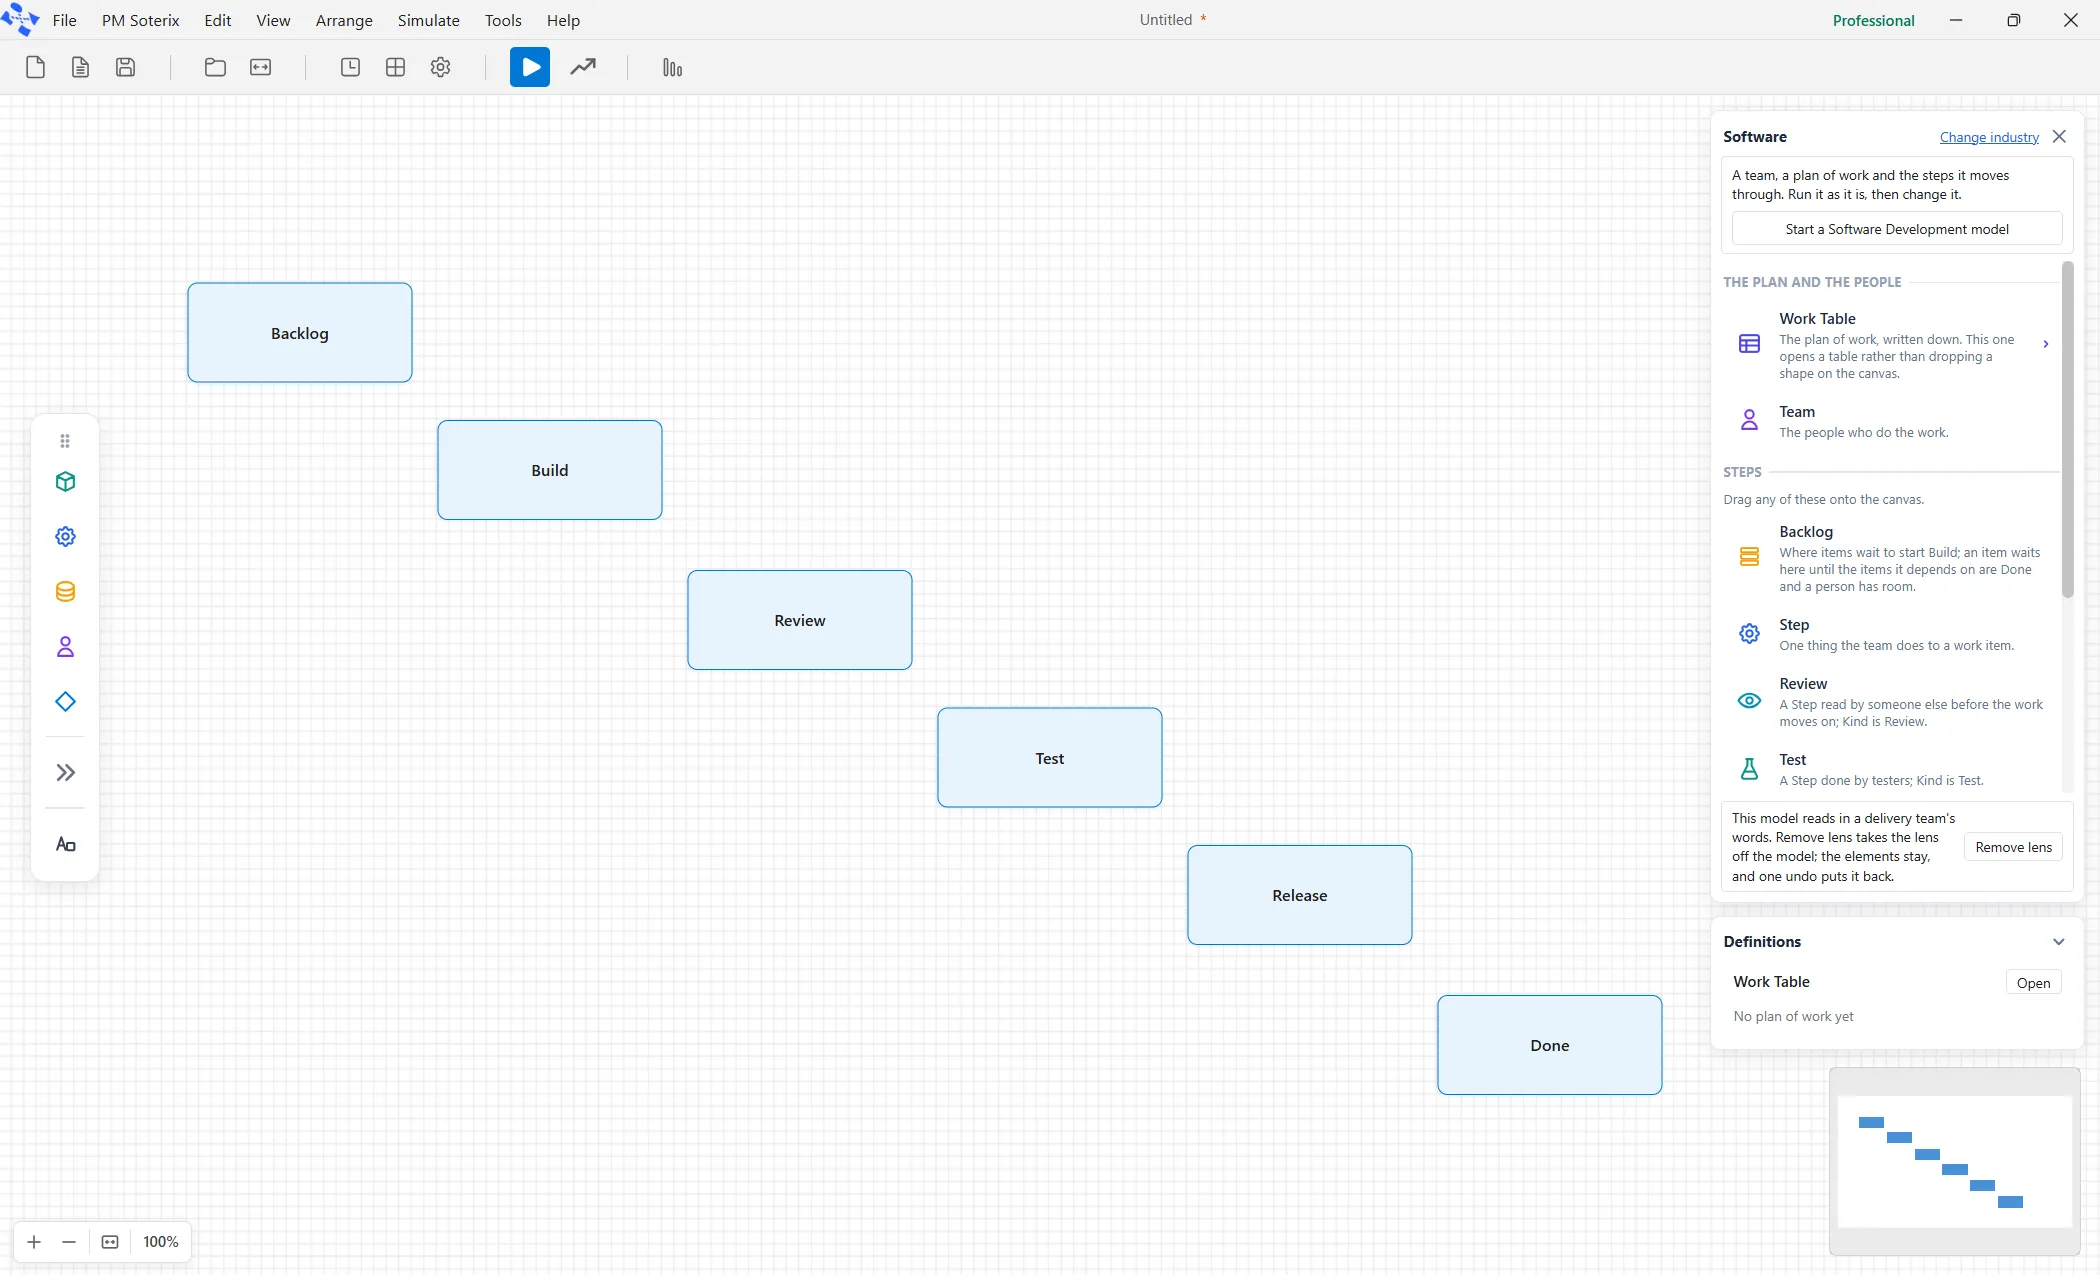
Section titled “5.2 Put the steps on the canvas”Drag these six tiles from the Software page onto the canvas, left to right with a good gap between them. A dragged tile lands where you drop it.
| Drag this tile | Drop it | What it is born with |
|---|---|---|
| Backlog | first, on the left | Kind of step already set to Backlog |
| Step | second | Nothing set. You will make this one Build in a moment. |
| Review | third | Kind of step already set to Review |
| Test | fourth | Kind of step already set to Test |
| Release | fifth | Kind of step already set to Release |
| Done | last, on the right | Kind of step already set to Other |
Rename the second one. Double-click its name on the canvas (or select it and press F2), type Build, and press Enter.
With Build still selected, look at the properties panel on the right, General tab. Find Kind of step and choose Build from the list. This is how the plan of work knows which step spends an item’s hours.
If you want them tidied up, Arrange ▸ Auto-Layout lines everything up once the arrows are drawn.
5.3 Add the work item
Section titled “5.3 Add the work item”The Software page has ten elements, and none of them is the work item itself. That is deliberate: a work item is a general element, and general elements live on the toolbar down the left of the canvas, which the lens never changes.
From the left toolbar, drag the tile named Entity onto the canvas, above and left of the Backlog. (The same thing is on the canvas right-click menu as Add Entity.)
Rename it Story (double-click the name, or use the Work item field on its General tab, which is what the lens calls the name field on this element).
5.4 Add the two teams
Section titled “5.4 Add the two teams”Drag the Team tile from the Software page onto the canvas, below the steps. Rename it Developers.
With it selected, on the General tab set People to 5.
Open the Shift tab. Working hours reads Always Available (24/7) because a new model has no working hours yet, and a team with none works around the clock. No software team does, so make some.
Click + New Schedule. An editor opens. Type a Schedule Name such as Office hours. Under Quick Presets click Office 9-5: the weekly grid fills in with weekdays nine to five. Press Create Schedule.
Back on the Shift tab, check that Downtime Rule reads Preempt & Wait. A Team dragged from the Software page is born with it. It means a person puts the work down at the end of the day and picks it up the next morning; the other setting keeps them working past five until the item is finished, and books hours nobody worked.
Drag a second Team onto the canvas. Rename it Testers and set People to 2. On its Shift tab choose the Office hours schedule you just made; it is in the list now.
Leave Speed, Starts on day, Learning curve, and the rest of the People tab empty. They are for modeling people who join late or who are still learning, and they belong to a later question, not a first model.
5.5 Write the plan of work
Section titled “5.5 Write the plan of work”The plan comes before the arrow that reads it, because the arrow needs something to point at.
Click the Work Table tile at the top of the Software page. It does not drag; it opens a window titled Work Table.
An empty window shows one blank row with the caret in Item, and it has no New button. Name the plan in the box at the top, such as Q4 plan.
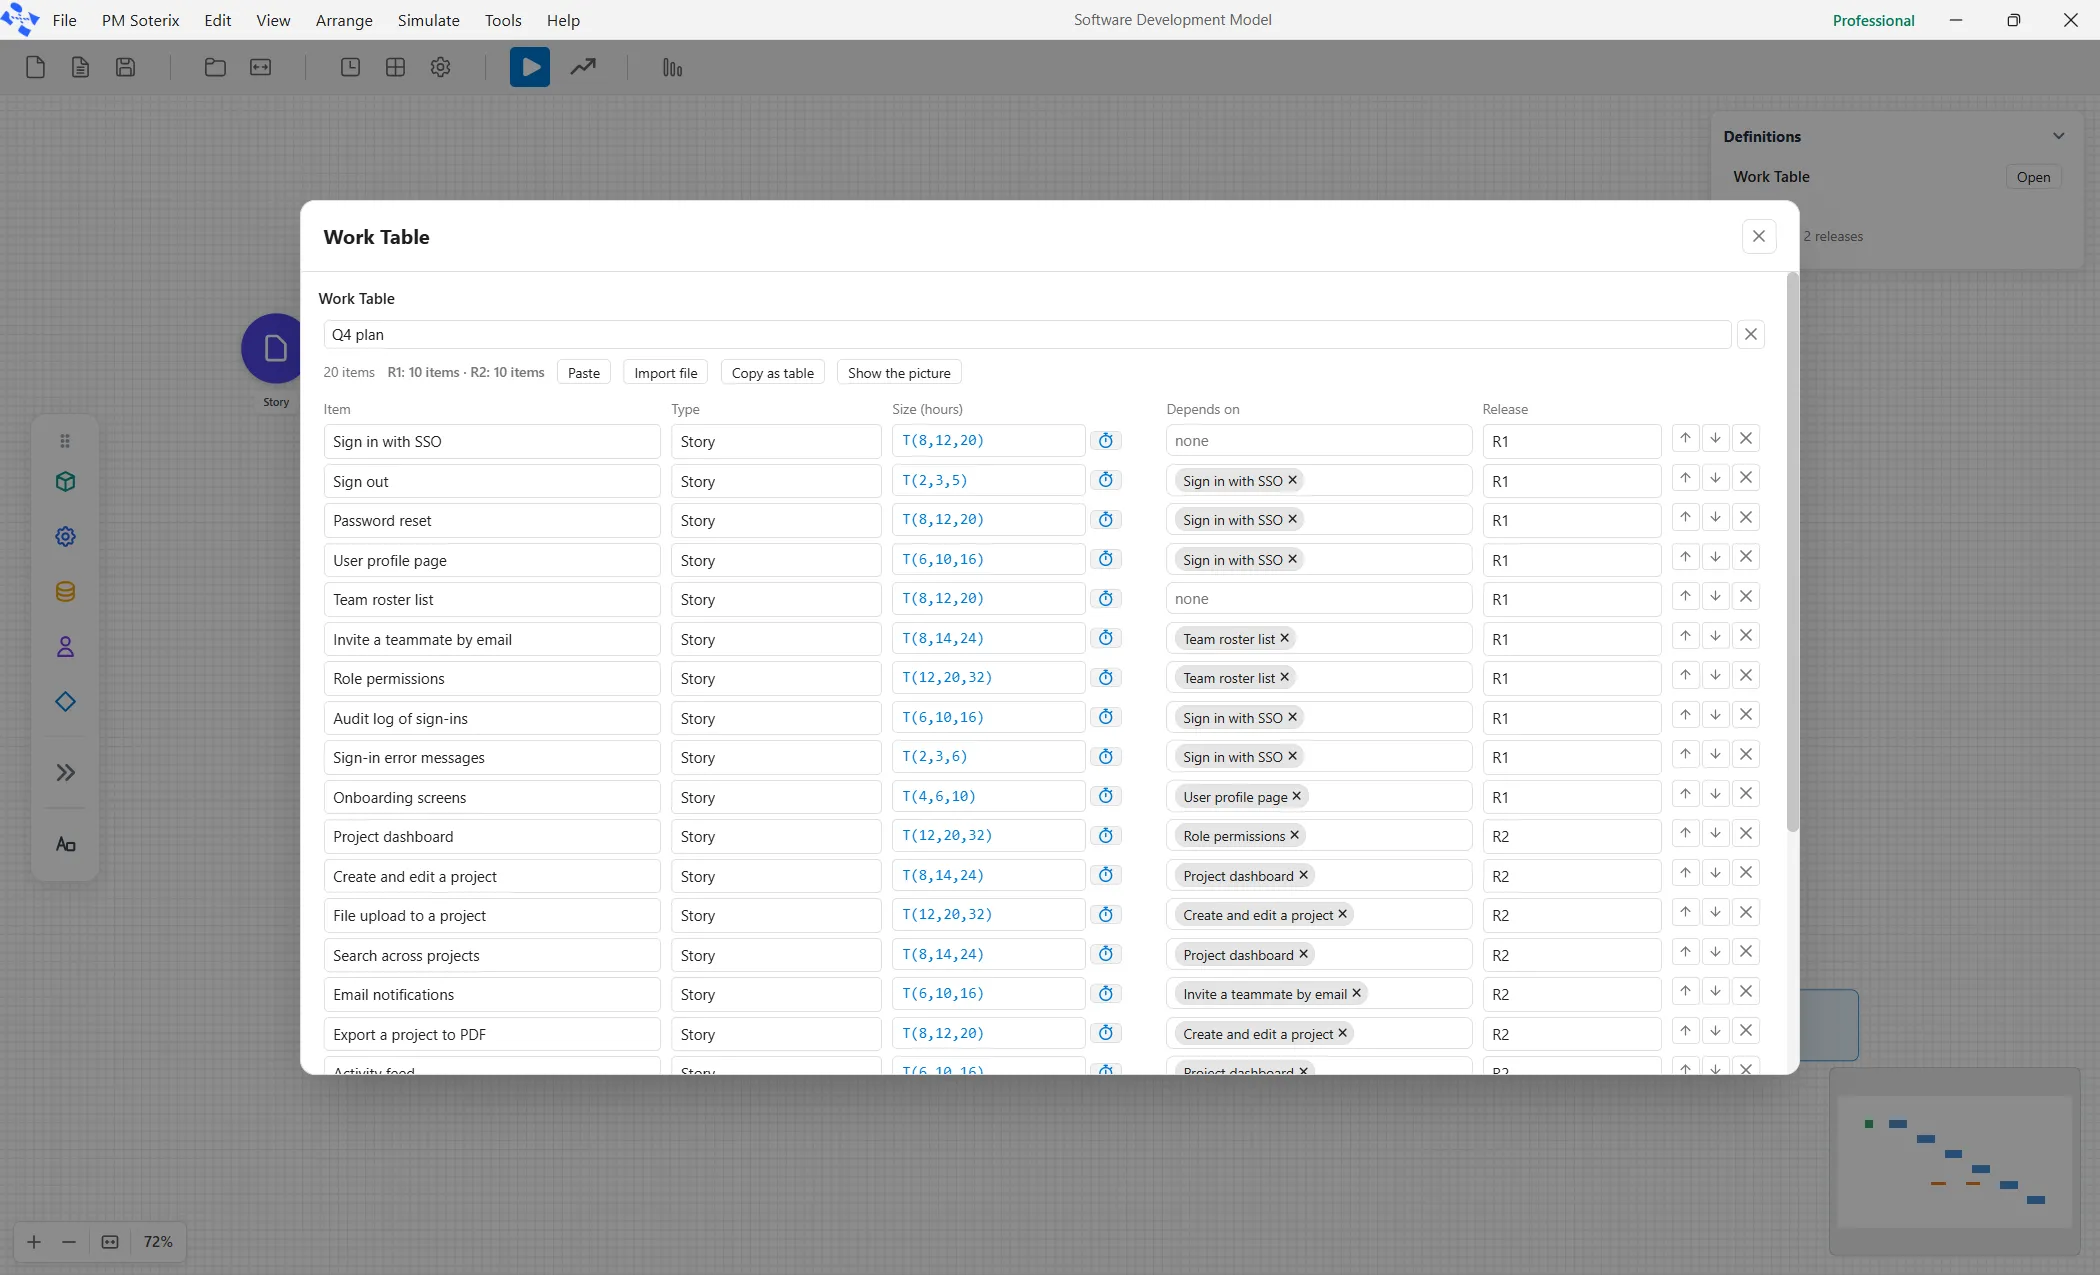
Type the first item in the blank row. The first keystroke creates the plan, and + Add Row appears below the grid. Press it for each row after the first and fill the five columns. Twenty rows is a few minutes of typing.
The columns are Item, Type, Size (hours), Depends on and Release. Depends on is chosen from the items you have already typed, so enter the rows in the order below and each dependency will be there when you need it.
| Item | Type | Size (hours) | Depends on | Release |
|---|---|---|---|---|
| Sign in with SSO | Story | T(8,12,20) | R1 | |
| Sign out | Story | T(2,3,5) | Sign in with SSO | R1 |
| Password reset | Story | T(8,12,20) | Sign in with SSO | R1 |
| User profile page | Story | T(6,10,16) | Sign in with SSO | R1 |
| Team roster list | Story | T(8,12,20) | R1 | |
| Invite a teammate by email | Story | T(8,14,24) | Team roster list | R1 |
| Role permissions | Story | T(12,20,32) | Team roster list | R1 |
| Audit log of sign-ins | Story | T(6,10,16) | Sign in with SSO | R1 |
| Sign-in error messages | Story | T(2,3,6) | Sign in with SSO | R1 |
| Onboarding screens | Story | T(4,6,10) | User profile page | R1 |
| Project dashboard | Story | T(12,20,32) | Role permissions | R2 |
| Create and edit a project | Story | T(8,14,24) | Project dashboard | R2 |
| File upload to a project | Story | T(12,20,32) | Create and edit a project | R2 |
| Search across projects | Story | T(8,14,24) | Project dashboard | R2 |
| Email notifications | Story | T(6,10,16) | Invite a teammate by email | R2 |
| Export a project to PDF | Story | T(8,12,20) | Create and edit a project | R2 |
| Activity feed | Story | T(6,10,16) | Project dashboard | R2 |
| Mobile layout pass | Story | T(8,12,20) | R2 | |
| Settings page | Story | T(4,8,12) | User profile page | R2 |
| Help center links | Story | T(2,3,5) | R2 |
The four rules the window enforces, and what they mean.
A size is a spread, never one number. T(8,12,20) means at least 8 hours, most likely 12, at most 20. The window refuses a bare number, because one number would throw away the uncertainty the plan actually has.
Row order is priority. Use the ↑ and ↓ buttons on a row to move it. The team works down the list.
Depends on names other rows. An item waits in the Backlog until every row it names is Done.
Release is filled on every row or on none, and an item may not depend on something in a later release, because it would wait forever. Both are refused before the run, not during it.
The window has no OK and no Cancel: every keystroke is already in the model. Close it with the ✕ or Escape. Ctrl+Z undoes an edit.
5.6 Draw the arrows
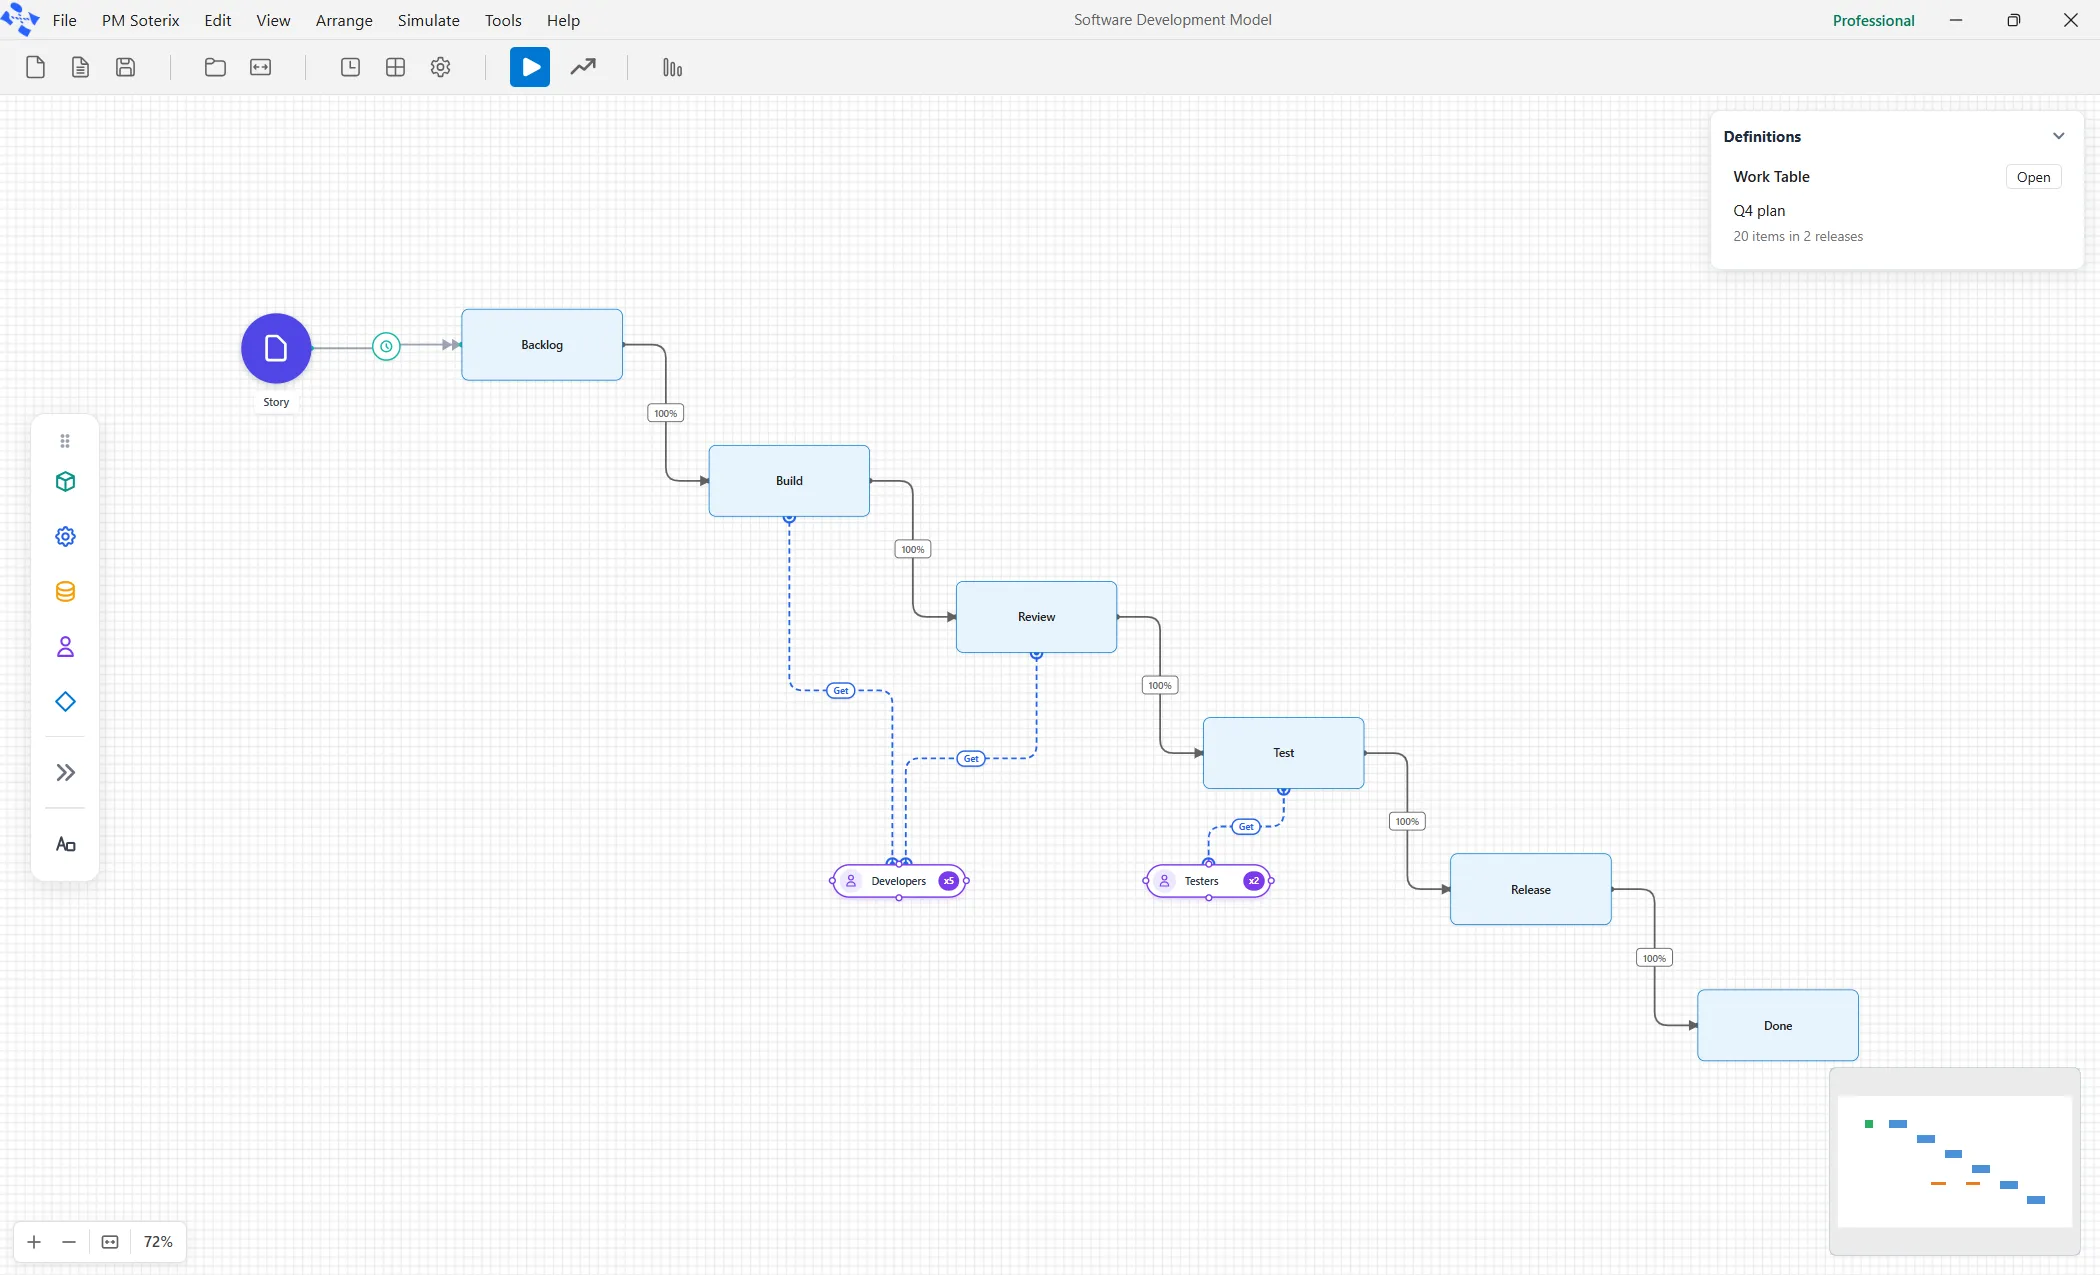
Section titled “5.6 Draw the arrows”An arrow is drawn by dragging from one element onto another. Hover over an element and small dots appear around its edge; drag from a dot on the first element and drop on the second. What kind of arrow you get depends on what you joined.
The route through the steps
Section titled “The route through the steps”Drag from Backlog to Build. A plain arrow appears.
Do the same from Build to Review, Review to Test, Test to Release, and Release to Done.
Nothing needs typing on these. Each is born carrying 100 percent, which is right when a step has only one way out. If you ever draw two arrows out of one step, that is when the Probability field on each of them starts to matter.
The arrival
Section titled “The arrival”Drag from Story to Backlog. This one is an arrival, not a route: it is how work enters the model.
With the arrow selected, look at the top of the properties panel. There is a dropdown there showing the kind of arrival, with no label beside it; out of the box, it reads Periodic. Open it and choose Work Table (described as Items from the model’s Work Table, in row order).
Three fields appear on the General tab. Set Work Table to the plan you named. Leave Pace on All at start, which puts every row into the Backlog on day one, in row order.
The other choice, N per sprint, feeds the plan in a few rows at a time and asks for How many per sprint and Sprint length. It is the right choice for a team that plans sprint by sprint, and it is worth trying later.
The people
Section titled “The people”Drag from the Developers team onto the Build step. A dashed line appears. Click it: the panel header reads Get / Free, and Quantity is 1. That is exactly right: the step takes one developer while it runs and gives them back afterward.
Drag from Developers to Review as well.
Drag from Testers to Test.
Backlog, Release and Done get no line. Nobody works them: the Backlog is where an item waits, and the other two are instants.
5.7 Say how long each step takes
Section titled “5.7 Say how long each step takes”Click each step in turn and set two things on its General tab: Effort, which is how long the step takes one person, and the middle box of the three small boxes, labelled People, which is how many people may be on that step at once.
| Step | Effort | Time Unit | People (on the step at once) |
|---|---|---|---|
| Backlog | 0 | M | leave as it is |
| Build | a_hours * 60 (see below) | M | 5 |
| Review | T(0.5,1,2) | H | 5 |
| Test | T(2,4,8) | H | 2 |
| Release | 0 | M | 999 |
| Done | 0 | M | leave as it is |
The Release step needs room for every item that could be waiting to ship, which is why it gets 999 rather than 1. If it is left small, an early release can end up stuck behind a later one, and the product will say so before the run starts.
5.8 Run settings
Section titled “5.8 Run settings”Open Simulate ▸ Options (Ctrl+Shift+O). The Simulation options window opens on its Run group.
Set Run length to 90 and click Day beside it. The run must be long enough for every run to finish, or the Forecast has nothing to report for the ones that didn’t.
Set Runs to 30.
Below Repeatable runs, a line shows the run length in weeks.
Set Plan date to 20. This is the day the plan says the work is due, counted from the start of the run; the report then tells you how often the plan was met. Twenty working days is four weeks, which is what a team would have promised for this much work.
Leave Working day empty. The report counts an eight-hour day when the box is empty.
Animation is a group of its own on the left rail. Click Animation to look: once Runs is above 1 the switch is already off and disabled, held off while more than one replication runs. Animation plays the run at the pace of the clock and a ninety-day run would take hours. A new model starts with it on, so with Runs at 1 you would switch it off before a forecast.
Press Apply.
5.9 Run it and read it
Section titled “5.9 Run it and read it”Press Run Simulation. Thirty runs of this model take a few seconds.
On Simulation Complete, click Yes.
Read the five tabs in this order.
| Tab | What to read first |
|---|---|
| Forecast | Read the whole program, then each release. Read the middle reading, Most runs by (P85). That is the date to promise. Under it, where the runs finished, shows the spread. |
| Flow | Scroll to Blocked, per item. Anything with a large Blocked figure was waiting for another item, not for a person. Then Flow efficiency: the share of each item’s elapsed time that anyone was actually working on it. Ten to twenty percent is normal for a real team. |
| Team | The utilization tiles and the Resources table, which show how busy each team was. The People over time chart, with its Effective capacity line, is always on this tab. It says “This run has no weekly staffing to draw” until a team carries start dates or a learning curve, which is the model in 5.11. |
| Quality | Items checked, and by the kind of step. With no rework route in this model, the middle card says there is none, which is correct. |
| Cost | Absent until the run has cost data. Set an hourly rate on each team’s Cost tab and run again if you want the money. |
If a run does not finish. If the Forecast says not reached for some runs, the run length was too short. Raise it in Simulate ▸ Options and run again. Never shorten the plan to make the report look better; that is the one change that makes a forecast flatter and more optimistic at the same time.
5.10 Save it
Section titled “5.10 Save it”File ▸ Save As (Ctrl+Shift+S). Type a MODEL NAME, choose a folder, press Save Model. One file ending in .pmd holds the drawing, the plan of work, the teams, the lens and the run settings.
5.11 What to try next
Section titled “5.11 What to try next”Ask a what-if without disturbing the model. Tools ▸ Logic Builder (Ctrl+Shift+L), then Scenarios, then Add new. A scenario is a named set of changes; each one runs its own thirty runs, and the Forecast tab lists them side by side under Scenarios compared. That is how the demo in Part 3 compares four choices.
Add the meetings. On each team’s People tab, add an interruption row for the stand-up, as in Part 4.
Feed the plan in sprints. Change the arrival’s Pace to N per sprint and watch the Flow tab’s Items finished per sprint section fill in.
Model somebody joining late. On a team’s People tab, add a row of people with a Starts on day and a learning curve, and read the People over time chart on the Team tab. That is the mechanism behind both shipped demos.
Part 6. Reference
Section titled “Part 6. Reference”6.1 Your words and the product’s words
Section titled “6.1 Your words and the product’s words”With the lens on, most of these are what you see on screen. The right-hand column is what the same thing is called with the lens off, which is worth knowing when you read general help.
| You would say | With the lens on | With the lens off |
|---|---|---|
| A story, a ticket, a task | Work item | Entity |
| The backlog, the sprint plan | Work Table | no equivalent; this is new |
| A story point estimate | Size (hours), as a spread | no equivalent |
| The team, the squad | Team, and People for its size | Resource, Quantity |
| A phase of work | Step, and Kind of step | Activity |
| How long a step takes | Effort | Processing Time |
| How many can work on it at once | People (on the step) | Capacity |
| Working hours | Working hours | Shift Schedule |
| Blocked | Waiting in the Backlog, reported as Blocked | Queue time |
| Code review | A Step whose Kind is Review | Activity |
| QA | A Step whose Kind is Test | Activity |
| CI, the build pipeline | A Step whose Kind is Pipeline | Activity |
| Deploy, ship | A Step whose Kind is Release | Activity |
| Code freeze | Freeze | A closed gate |
| Descoped | A Step whose Kind is Dropped | Activity |
| Meetings, questions, incidents | Interruptions | Interruptions |
| Onboarding | Learning curve | no equivalent |
| How many times to run it | Runs | Replications |
| When will it be done | The Forecast tab | no equivalent |
6.2 The numbers in this guide, and where they came from
Section titled “6.2 The numbers in this guide, and where they came from”The figures for the model built in Part 5 were measured on build 7.0.6528, thirty runs. The figures for the starter model and the two demos are the ones in their own briefs, the case studies behind their cards. Changes 1 to 5 quote no results: each asks you to compare a run with the one before it, because the days on your screen come from your own runs. If your screen differs, check that you changed only the field named.
| Where | What it reads |
|---|---|
| Starter model, Failed Tests, as it arrives | One run. Its brief reports the whole plan shipping on day 24, three days past a plan date of day 21: 54 tests run to pass 30 items, 24 of them send work back, and 17 items pass their first test. |
| Starter model with its scenario, Test while you build | Its brief reports the whole plan shipping on day 14, with 32 tests run, 2 sent back and 28 items passing their first test. |
| Three More People demo | Its brief, over five runs: do nothing day 351. Add three at month three, day 315. Add three at month one, day 303. Cut fifteen percent, day 290. All at Most runs by (P85), against a plan of day 273. |
The modeling assumptions in the two demos come from published research: a new person starting at half speed and reaching full speed after eighty working days, a fifth of an experienced person’s time going to each learner, and a coordination cost that grows with the number of pairs on a team. The demo briefs name their sources. Replace them with your own figures before quoting them to anyone.
6.3 Mistakes that waste a run
Section titled “6.3 Mistakes that waste a run”Typing a time in the wrong unit. The Time Unit control starts on M. A two-hour test typed as 2 with the unit untouched is a two-minute test.
A Type in the plan that matches no element. If the plan says Story, the model needs an element named Story. The rows have nothing to become otherwise.
A size typed as a single number. The window refuses it. A plan of single numbers finishes on nearly the same day every run, and the Forecast then tells you nothing.
A team with no working hours. It works around the clock and every date is optimistic. Set Working hours on the Shift tab.
Leaving a team on Finish Current. A person handed a ten-hour item on Monday morning works until half past seven that night to finish it, and the team books hours nobody worked. Teams want Preempt & Wait.
Promising the first column. Half the runs by is the day you beat half the time, so promising it means being late half the time. Promise Most runs by (P85).
Adding people to a plan that cannot use them. Look at Blocked, per item on the Flow tab first. If the work is waiting on other work, more people change nothing.
Running one replication and believing the date. One run is one possible future.
6.4 Where everything is
Section titled “6.4 Where everything is”| To do this | Go here |
|---|---|
| Start an empty model | File ▸ New (Ctrl+N), or Blank Canvas on the Welcome screen |
| Open a model you saved | File ▸ Open (Ctrl+O), or Open from Computer on the Welcome screen |
| Open one of the shipped examples | File ▸ Demo Models, then the Industry list on the left |
| Show the Software elements | View ▸ Show Industry Palette, then the Software delivery card |
| Open the finished starter model, Failed Tests | The Start a Software Development model button on the Software page |
| Open the plan of work | The Work Table tile on the Software page |
| Change what an element does | Click it, and use the panel on the right |
| Reach a hidden properties tab | The eye icon at the foot of the tab icons |
| Set the run length and how many runs | Simulate ▸ Options (Ctrl+Shift+O) |
| Run | The play button on the toolbar, or Simulate ▸ Run Simulation (Ctrl+R) |
| Open the report again | Tools ▸ Output Report (Ctrl+Shift+R) |
| Compare what-if cases | Tools ▸ Logic Builder (Ctrl+Shift+L), then Scenarios |
| Tidy the drawing | Arrange ▸ Auto-Layout |
| Save | File ▸ Save (Ctrl+S) or File ▸ Save As (Ctrl+Shift+S) |
List of figures
Section titled “List of figures”- Figure 1. The Welcome screen: the left sidebar, the Start New Model tiles, and Recent Models.
- Figure 2. The main window with a model open: menus, toolbar, canvas, the element toolbar on the left, and the properties panel on the right.
- Figure 3. The Software face of the industry palette: the Start a Software Development model button, the ten elements with their sentences, and the lens row at the foot.
- Figure 4. The Demo Models window with Software Development selected in the Industry list and its three cards showing.
- Figure 5. The starter model on the canvas: Work Item, Backlog, Build, Review, Test, Release and Done as a staircase, with Fix below the line between Review and Test and the Delivery Team below.
- Figure 6. The Work Table window with the starter plan’s thirty rows.
- Figure 7. The Forecast tab on the first run: three readings for the whole program and for each release, and the chart of where the runs finished.
- Figure 8. The Flow tab, scrolled to the Blocked, per item section.
- Figure 9. The Forecast tab across thirty runs: three readings per row and the Where the runs finished chart.
- Figure 10. The Delivery Team properties, People tab, with the Interruptions table and the Stand-up row.
- Figure 11. The six steps on the canvas after they have been dragged from the Software page.
- Figure 12. The Work Table window with the twenty rows typed in.
- Figure 13. The finished model: Story and the six steps joined left to right, with the two teams below and their dashed lines to Build, Review and Test.