

Reading the results
The Results step turns a run into a decision. It opens with the answer, then lets you dig into why, compare configurations fairly, and keep the one you choose.
The winner strip
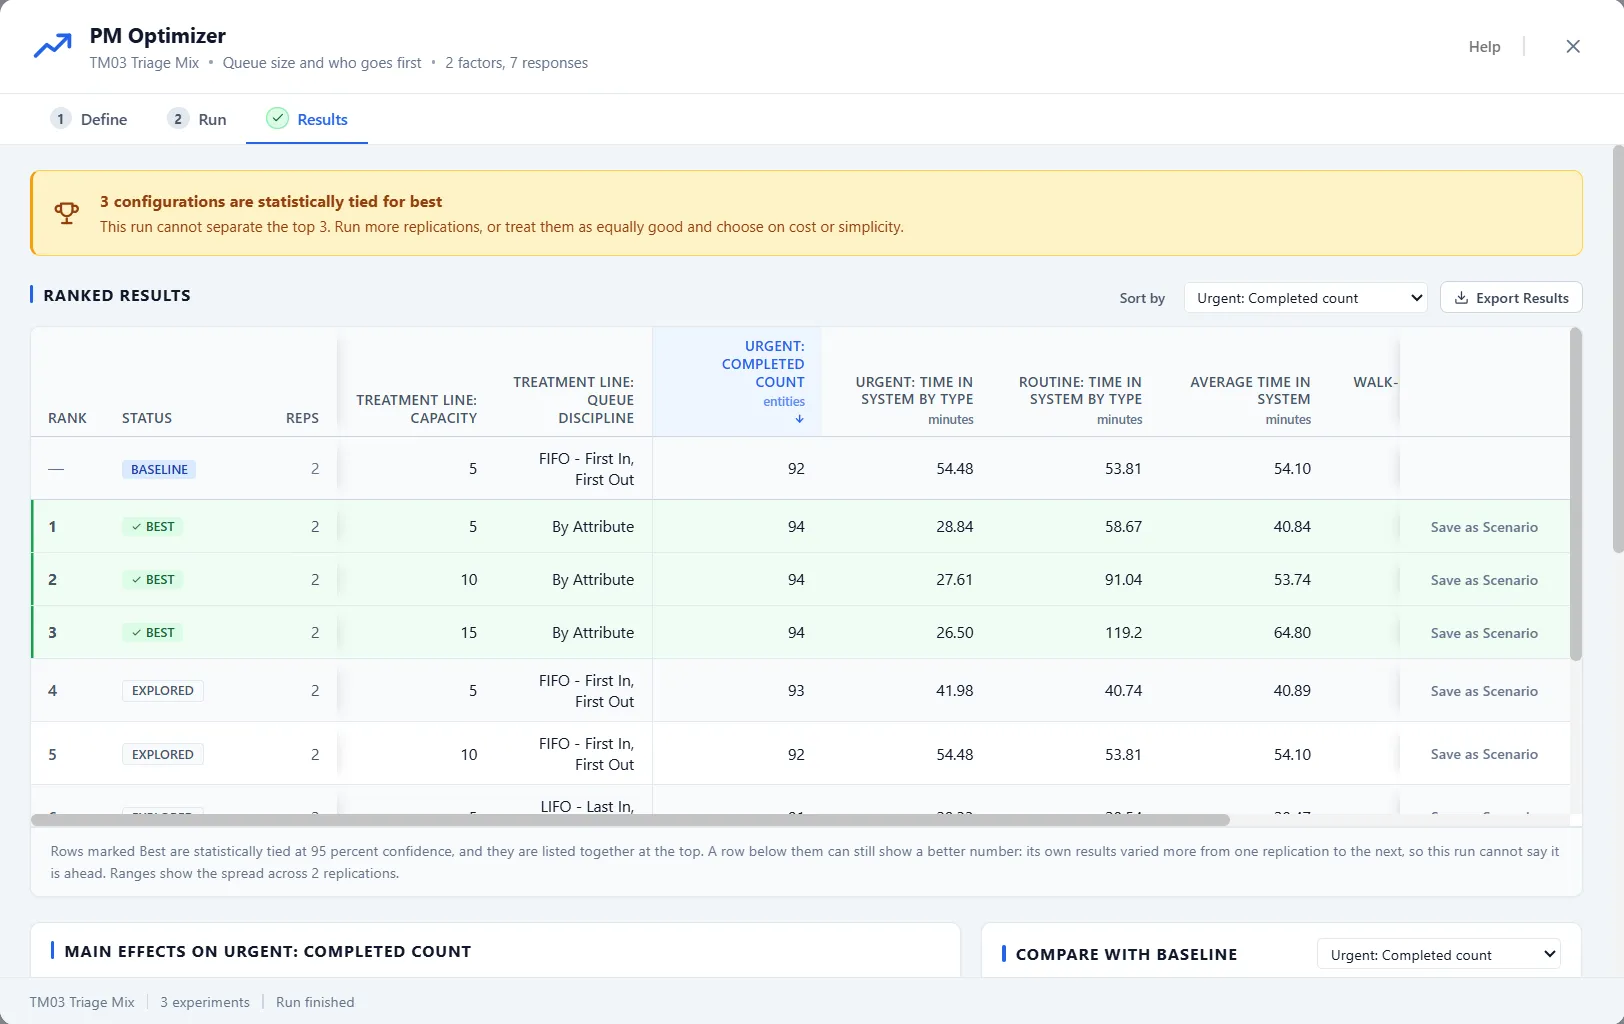
Section titled “The winner strip”A band at the top says what the run can honestly claim. When one configuration separated itself, it is named, with how much better it is than the rest and how sure that is. When the leaders cannot be told apart, the strip says so plainly: how many configurations are statistically tied for best, and that you can run more replications or treat them as equally good and choose on cost or simplicity. It never claims a single perfect answer it cannot back up. If the analysis behind the strip fails, Try again appears beside it.
Tie-breaking is part of the run itself, not something to click afterwards. While the search runs, the leading configurations automatically earn extra replications, the whole tied group together, until the group stops changing. A tie that survives that is a real tie, which is often good news: it means you can choose among the leaders on cost or simplicity.
Ranked results
Section titled “Ranked results”Below it, every configuration is listed in order: Rank, Status, Reps (how many replications the row ran), the factor settings, each response with its spread, and Save as Scenario at the end of the row. Sort by any response with the control in the header, and use Export Results beside it to save the full table as a spreadsheet.
A Baseline row leads the table: your model today, unchanged, so you can always see what the search was competing against. For an experiment that started from a scenario, the Baseline row measures that scenario as seeded, switched care models and removals included, and the Started from caption names the scenario. Rows marked Best, grouped on green right under it, are the ones statistically tied for first: within the run’s precision you cannot tell them apart, so the table says so rather than pretending the top row is uniquely best.
The Status column gives every row a plain account:
- Best: in the group tied for first.
- Leader, refined: it earned extra replications as a leader and still could not be separated from the pack.
- Explored: the first pass every configuration gets.
- Cut short: the search could already tell it was losing and stopped spending runs on it, with the reason on the row.
- Over a limit: it finished but broke one of your limits, so it is out of the ranking.
- Failed: it did not finish, with the reason spanning the row.
What mattered, and how
Section titled “What mattered, and how”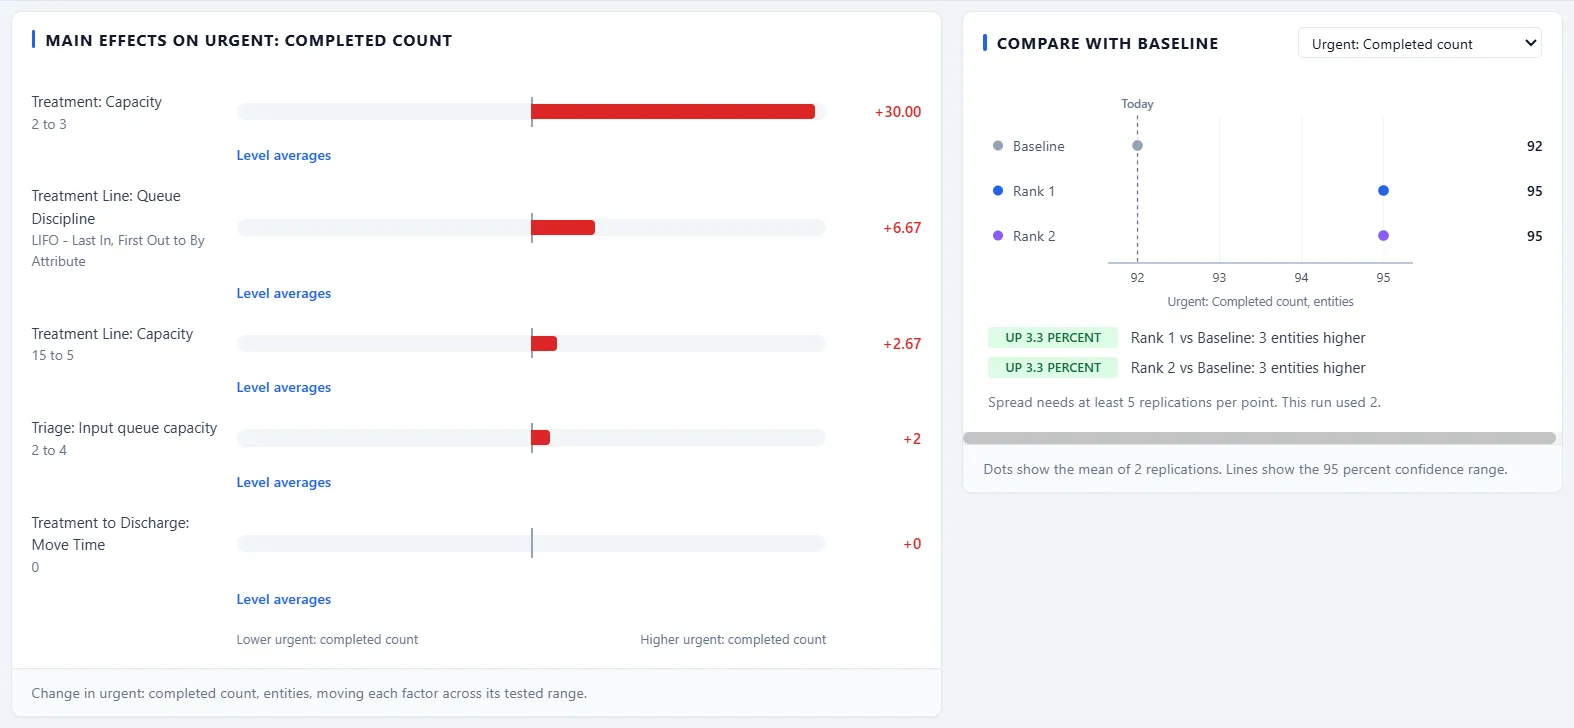
The main effects chart shows how much each factor changed the result as it moved across its tested range, biggest mover at the top. Compare with baseline puts the leading configurations next to your current model as points with 95 percent confidence ranges, so a difference only reads as real when the ranges are clear of each other. For the full statistics behind the picture, open the detail from the button below the chart.
Under each main effect, Level averages opens a small table: for each level of that factor, the average response, with the number of Points and Runs behind it. Under the comparison, Show the spread across replications draws, behind each interval, the lowest to the highest replication, the middle half of them and the median. It needs at least 5 replications per point. With fewer, a note says so: “Spread needs at least 5 replications per point. This run used 2.”
Where the sweet spot is
Section titled “Where the sweet spot is”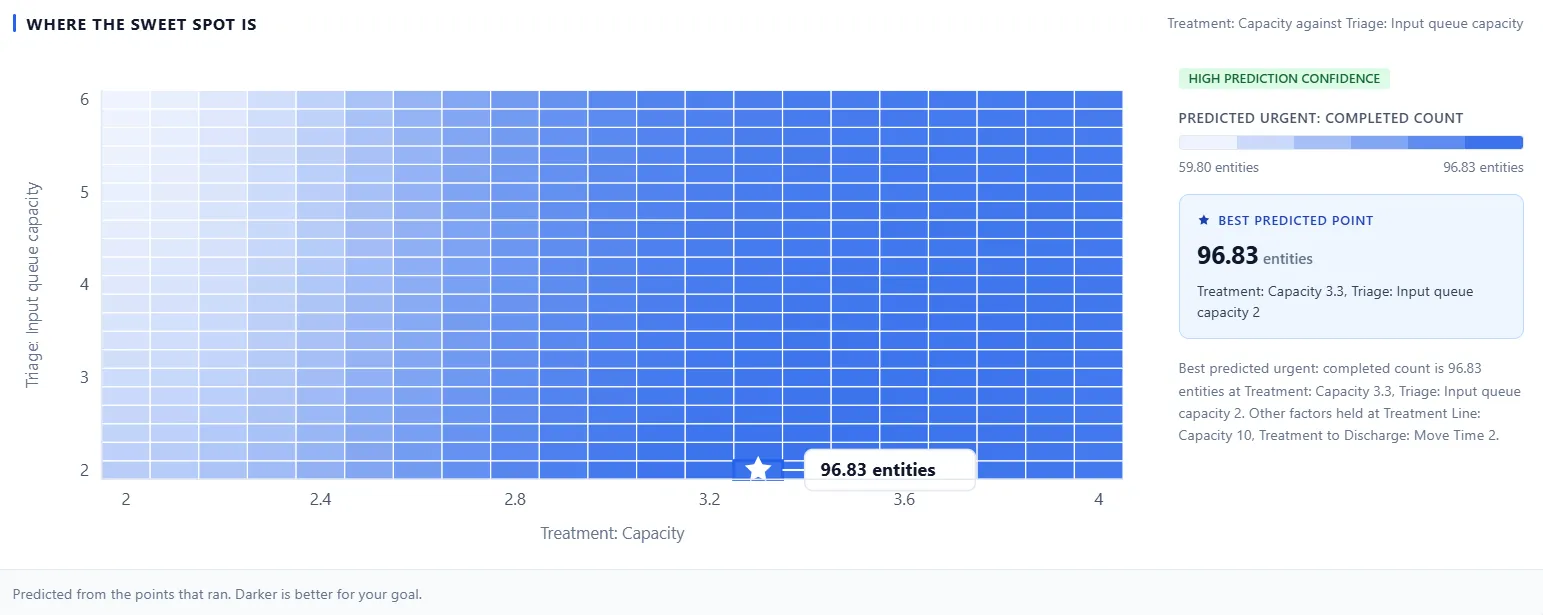
For two numeric factors, the sweet-spot map predicts the result across the whole area from the points that ran, with darker meaning better for your goal and a star on the best predicted point. It fills in the gaps between the configurations you actually ran, and tells you how much to trust the prediction.
What the run could not answer
Section titled “What the run could not answer”At the foot of the step, a panel called What This Run Could Not Answer lists, in plain words, whatever the analysis had to work around. It appears only when there is something to say.
Keeping a result
Section titled “Keeping a result”When you have chosen, Save as Scenario copies that configuration into your model as an ordinary scenario, enabled and ready to run. When the button cannot act it is grayed out, and the reason is its hover tooltip: for example, the model has changed since the run was saved, the configuration uses something that is no longer in the model, or the run started from a scenario that has since changed or been deleted. In that last case the tooltip names the scenario and says it “has changed since” or “has been deleted since”, and a renamed scenario reads as deleted. Each reason ends with advice to run the experiment again, then save from the fresh result.
The last completed run is saved with the model, so closing the window loses nothing: reopen the model later and PM Optimizer opens straight back on this step, ranked table and all. A line above the results says where they came from, in the form “Results from Oct 3, 2026, saved with this model.”
That holds for a saved experiment. A run belongs to the experiment it ran for, so it is kept with the model only once that experiment is saved. A new draft, or a definition you have edited since the run, has no saved experiment to keep the run with: save it with Save Experiment. Saving a changed definition (a rename does not count) drops the finished run and its saved results, and the Run and Results steps lock again, as they are for a new experiment. When you leave an experiment with unsaved changes, a question offers Save, Discard or Keep editing, and when a finished run would go with them it adds “and the results of its finished run go with it.”