

Ishikawa Diagram
An Ishikawa diagram, also called a cause-and-effect or fishbone diagram, is a tool for finding the root causes of a problem. The problem sits at the head of the fish, and possible causes branch off the spine, usually grouped into categories such as people, method, machine, material, measurement, and environment.
In process improvement
Section titled “In process improvement”An Ishikawa diagram often comes before building a simulation: it surfaces the factors that might drive a problem, whether delay, cost, or defects, so you know what to represent in the model. Once the model runs, it shows which of those suspected causes actually change the outcome.
LegacyHow this worked in the previous version
Ishikawa diagrams (also called fishbone diagrams or cause-and-effect diagrams) are diagrams that show the causes of a certain event. Common uses of the Ishikawa diagram are to identify potential factors causing an overall effect. Each cause or reason for imperfection is a source of variation. Causes are usually grouped into major categories to identify these sources of variation.
More Information
Section titled “More Information”Background
Section titled “Background”Ishikawa diagrams were proposed by Kaoru Ishikawa in the 1960s, who pioneered quality management processes in the Kawasaki shipyards, and in the process became one of the founding fathers of modern management.
It was first used in the 1960s, and is considered one of the seven basic tools of quality management, along with the histogram, Pareto chart, check sheet, control chart, flowchart, and scatter diagram. It is known as a fishbone diagram because of its shape, similar to the side view of a fish skeleton.
How is this Relevant to ProcessModel, Process Improvement and Simulation?
Section titled “How is this Relevant to ProcessModel, Process Improvement and Simulation?”- In some processes you will find problems for which the cause cannot be easily determined.
- ProcessModel has a great “fishbone” diagramming tool built-in
When To Use It
Section titled “When To Use It”You may find it helpful to use the Ishikawa diagram in the following cases:
- To analyze and find the root cause of a complicated problem
- When there are many possible causes for a problem
- If the traditional way of approaching the problem (trial and error, trying all possible causes, and so on) is very time consuming
- The problem is very complicated and the project team cannot identify the root cause
Then Not To Use It
Section titled “Then Not To Use It”Of course, the Fishbone diagram isn’t applicable to every situation. Here are a just a few cases in which you should not use the Ishikawa diagram because the diagrams either are not relevant or do not produce the expected results:
- The problem is simple or is already known.
- The team size is too small for brainstorming.
- There is a communication problem among the team members.
- There is a time constraint; all or sufficient headcount is not available for brainstorming.
- The team has experts who can fix any problem without much difficulty.
Causes
Section titled “Causes”Causes in the diagram are often categorized, such as to the 4 M’s, 8 P’s or 4 S’s described below. Cause-and-effect diagrams can reveal key relationships among various variables, and the possible causes provide additional insight into process behavior.
Causes can be derived from brainstorming sessions. These groups can then be labeled as categories of the fishbone. They will typically be one of the traditional categories mentioned above but may be something unique to the application in a specific case. Causes can be traced back to root causes with the 5 Whys technique. Typical categories are:
The 4 M’s (Used in manufacturing)
Section titled “The 4 M’s (Used in manufacturing)”- Machine (Equipment)
- Method (Process/Inspection)
- Material (Raw,Consumables etc.)
- Man power
The 8 P’s (Used in service industry)
Section titled “The 8 P’s (Used in service industry)”-
Product
-
Price
-
Place/Plant
-
Promotion
-
People
-
Process
-
Physical Evidence
-
Productivity & Quality
The 4 S’s (Used in service industry)
Section titled “The 4 S’s (Used in service industry)”- Surroundings
- Suppliers
- Systems
- Skills
Steps:
Section titled “Steps:”- Define the problem
- Brainstorm
- Identify the causes
- Eliminate unimportant causes
- Take action on remaining causes
Cause-and-effect diagram
Section titled “Cause-and-effect diagram”The Cause and Effect diagram identifies many possible causes for an effect or problem. It can be used to structure a brainstorming session. It immediately sorts ideas into useful categories.
How to Develop a Cause and Effect Diagram
Section titled “How to Develop a Cause and Effect Diagram”- Agree on a problem statement (effect). Place an activity at the center right of the ProcessModel layout. Write the problem statement in the activity. Use the cause and effect line style to draw a line connecting to the problem statement.
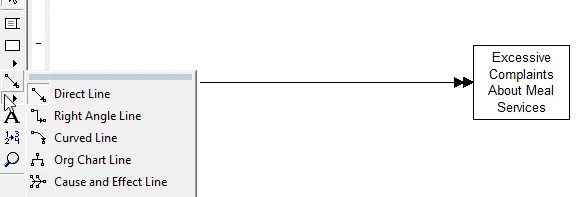
Cause and Effect diagram problem statement.
- Brainstorm the major categories of causes of the problem. If this is difficult use generic headings:
Methods
-
Machines (equipment)
-
People (manpower)
-
Materials
-
Measurement
-
Environment
-
Write the categories of causes as branches from the main arrow. Use the connector tool to draw connectors attaching to the backbone of the diagram and type after each line is completed to create the headings.
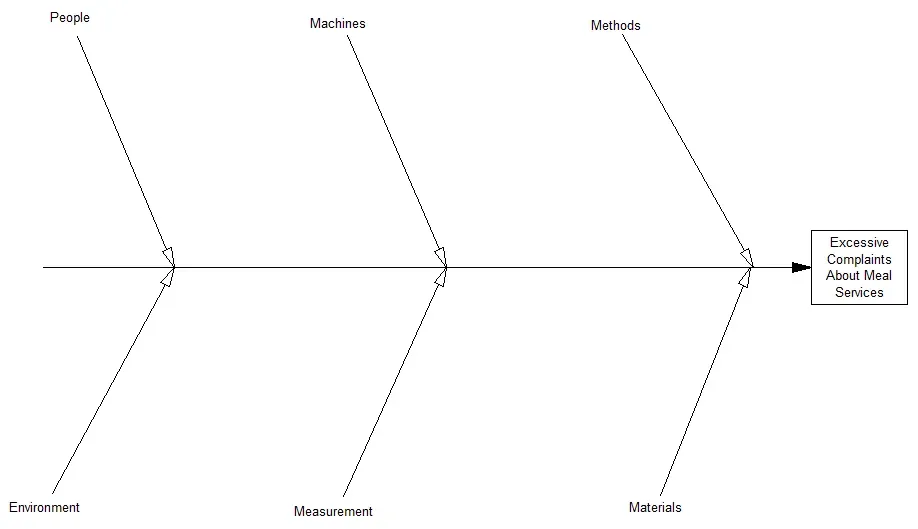
Adding categories to the cause and effect diagram.
- Brainstorm all the possible causes of the problem. Ask: “Why does this happen?” As each idea is given, the facilitator creates it as a branch from the appropriate category. Causes can be created in several places if they relate to several categories.
- Again ask “why does this happen?” about each cause. Write sub-causes branching off the causes. Continue to ask “Why?” and generate deeper levels of causes. Layers of branches indicate causal relationships.
- When the group runs out of ideas, focus attention to places on the chart where ideas are few.
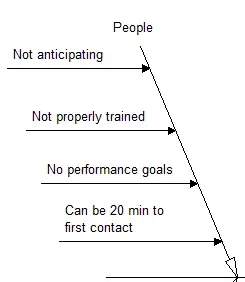
*Cause and Effect sub-categories *
or
**
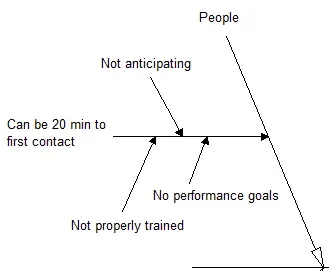
Reorganizing causes may yield greater clarity and understanding.
Why use ProcessModel to create a Cause and Effect diagram?
Section titled “Why use ProcessModel to create a Cause and Effect diagram?”These diagrams can be drawn on a white board, on a flip chart or put together using sticky notes. They are especially easy to draw if you know what they look like ahead of time. The problem is that you don’t know what the diagram is going to look like ahead of time. Much of the time is spent correcting, redrawing or moving things around. ProcessModel has great features for:
- Moving items to other locations on the diagram
- Copying elements
- Spell checking
- Deleting
- Resizing
- Printing
- Templates
Also known as: Ishikawa Diagram, Fishbone Diagram.