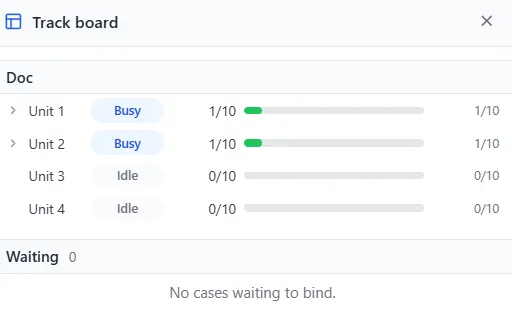






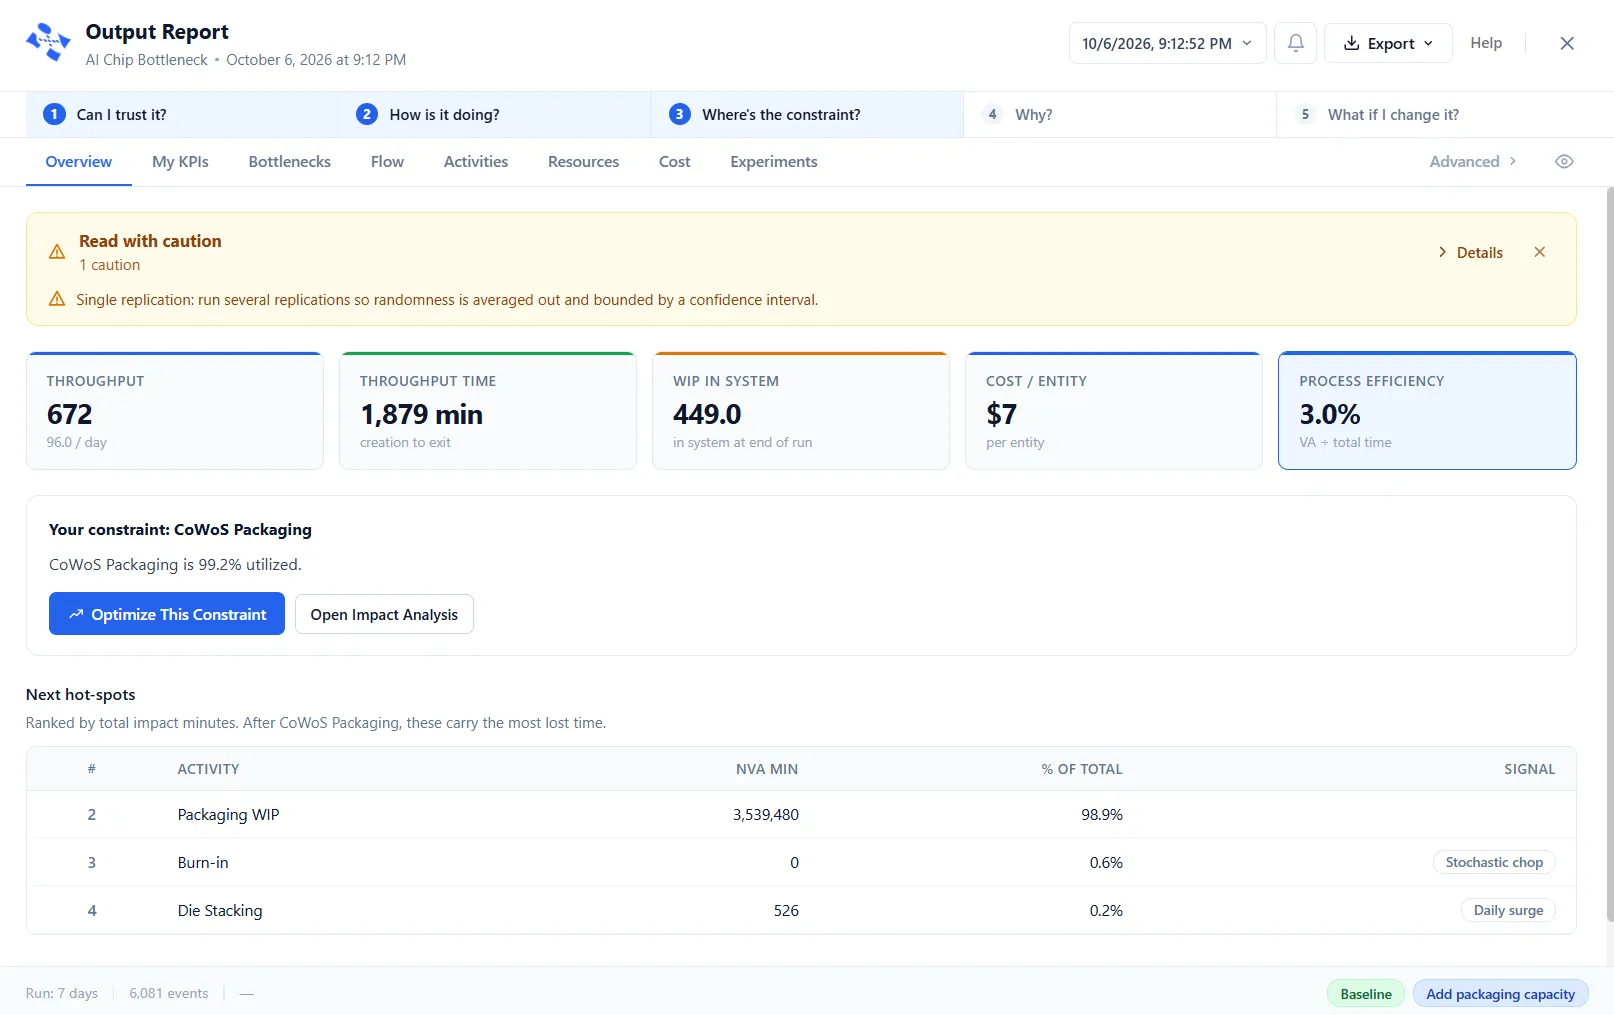

A KPI summary at a glance
Throughput, average time in system, the headline bottleneck, and work in process, the moment a run finishes.
ProcessModel shows you where work slows, where resources misalign, where queues build, and where cost accumulates. Then it shows you what to change, why it matters, and what the result will look like, by testing the improvement before you touch the real operation.

Trusted by teams at leading organizations


The problem, and our approach
Work slows in places that are hard to see. Queues build, resources sit idle while others run hot, and cost accumulates a step at a time. The obvious bottleneck is rarely the real one, and changing the wrong thing is expensive.
ProcessModel makes the whole process visible, then lets you test a change safely. Fix the highest-impact constraint first, measure the result, and move on to the next. You change the real operation only once you have seen it work.

AI and simulation
AI accelerates building the model and interpreting the results. A real simulation does the rigorous analysis underneath.
Describe the process and AI maps it for you. After a run it explains the results in plain language and answers your follow-up questions, grounded in your own activity, resource, and entity names, so you spend less time wrestling with the model and more time improving the work.

A real discrete-event engine tests complex scenarios with real resources, queues, variability, routing, and costs, then measures the performance you would actually get. It shows how a change behaves under load, long before it reaches the floor.

How it works
Four steps, start to finish: describe it, run it, find the constraint, and prove the fix.
Describe
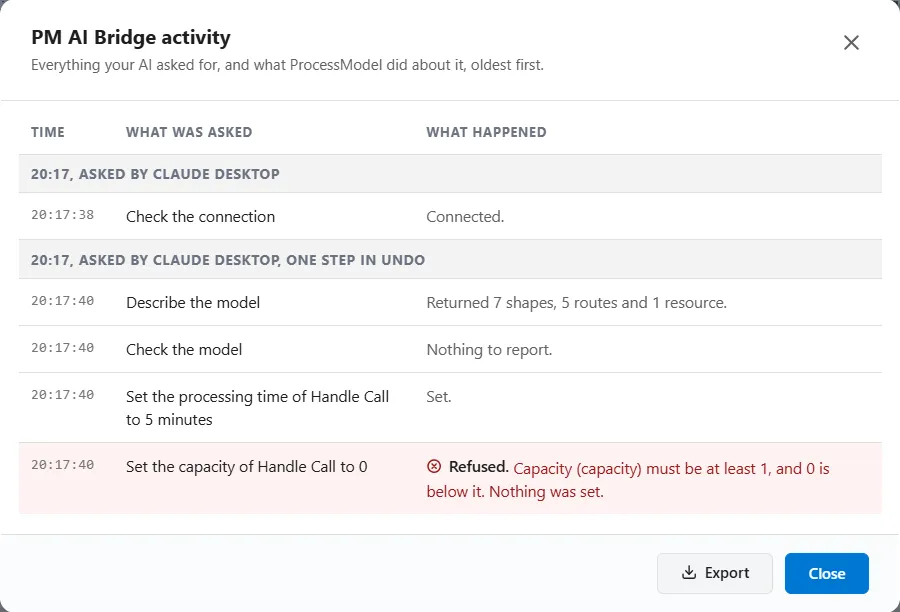
Describe your process in plain language and AI builds the model, or describe a change to extend a model you already have. In Research mode it can use realistic data for a country or region you choose, with a preview before anything changes.

Simulate
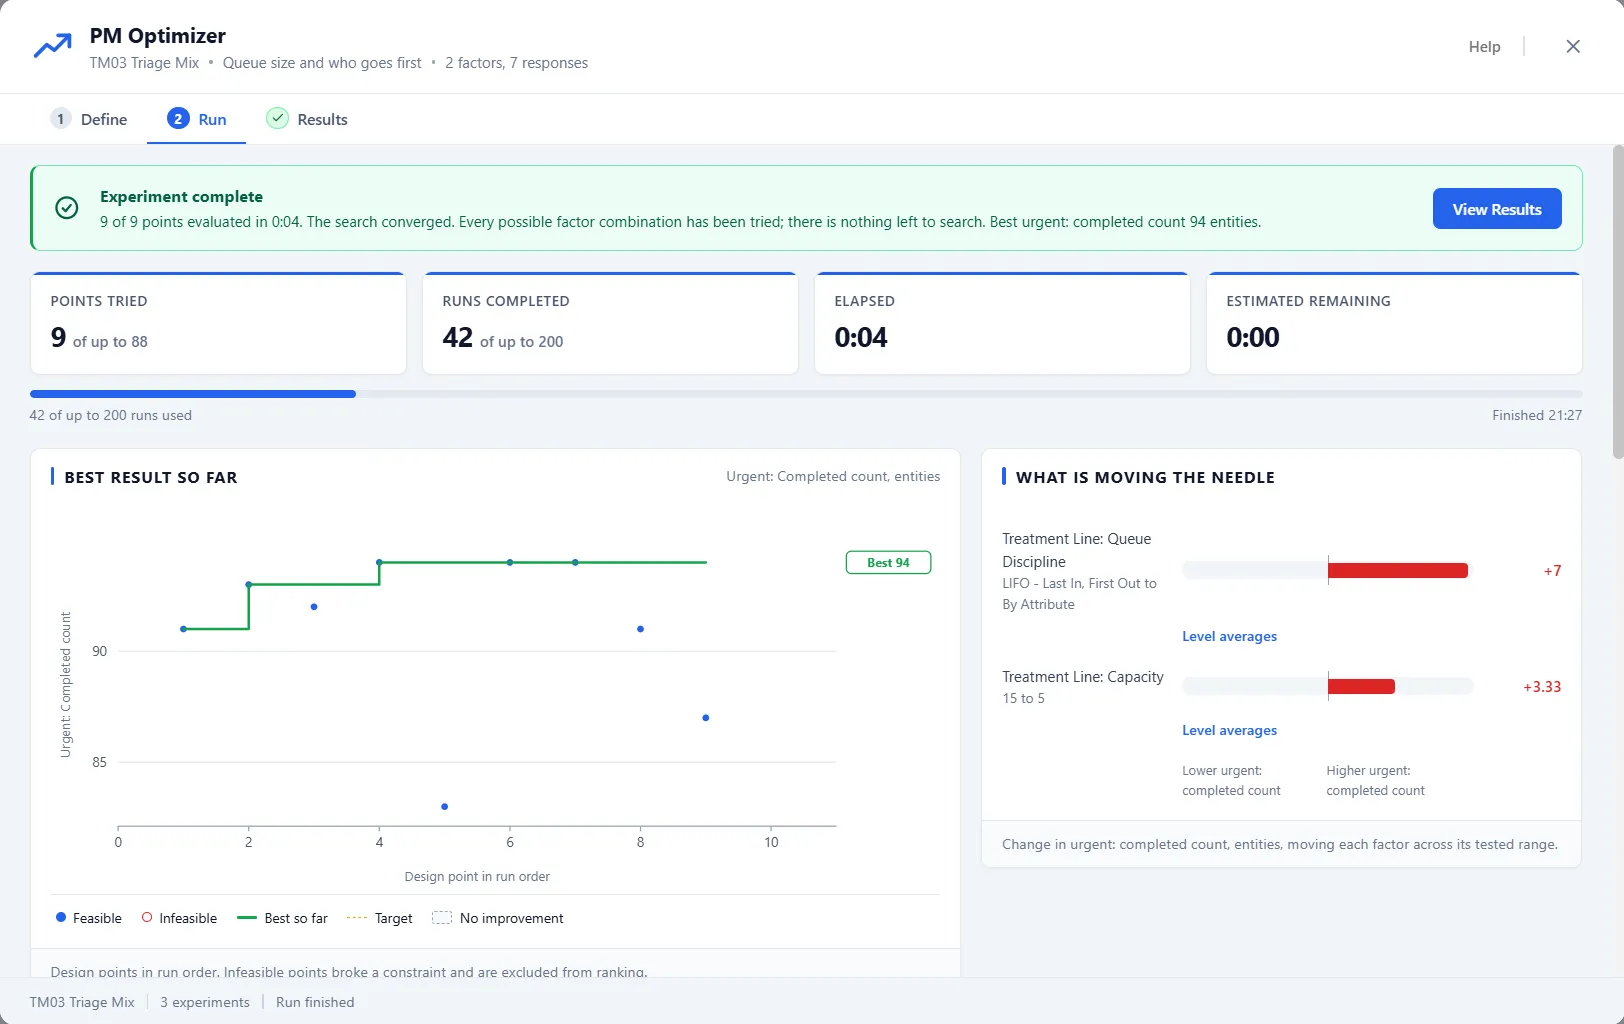
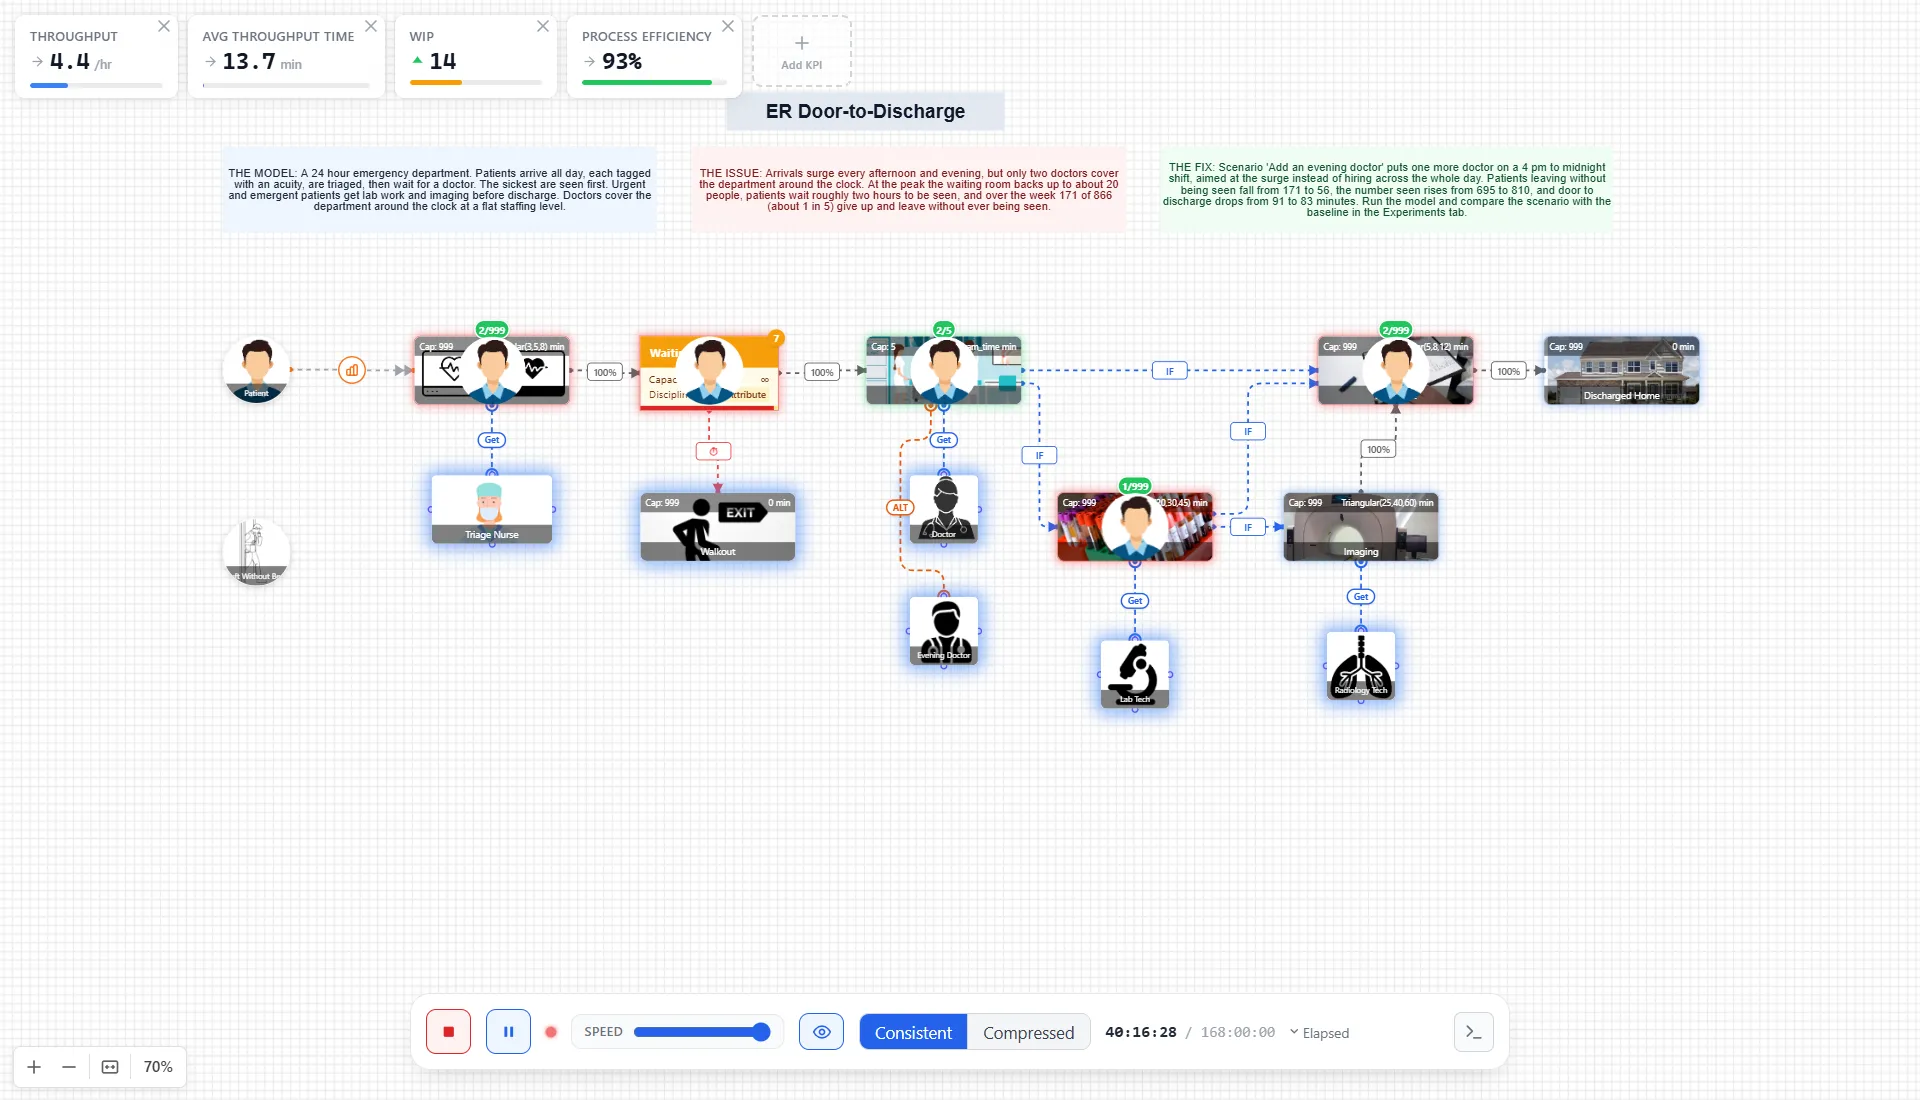
Run the simulation across many replications and watch the work move through your process. Real resources, queues, and variability play out so the flow comes to life and the numbers reflect reality.

Find the bottleneck
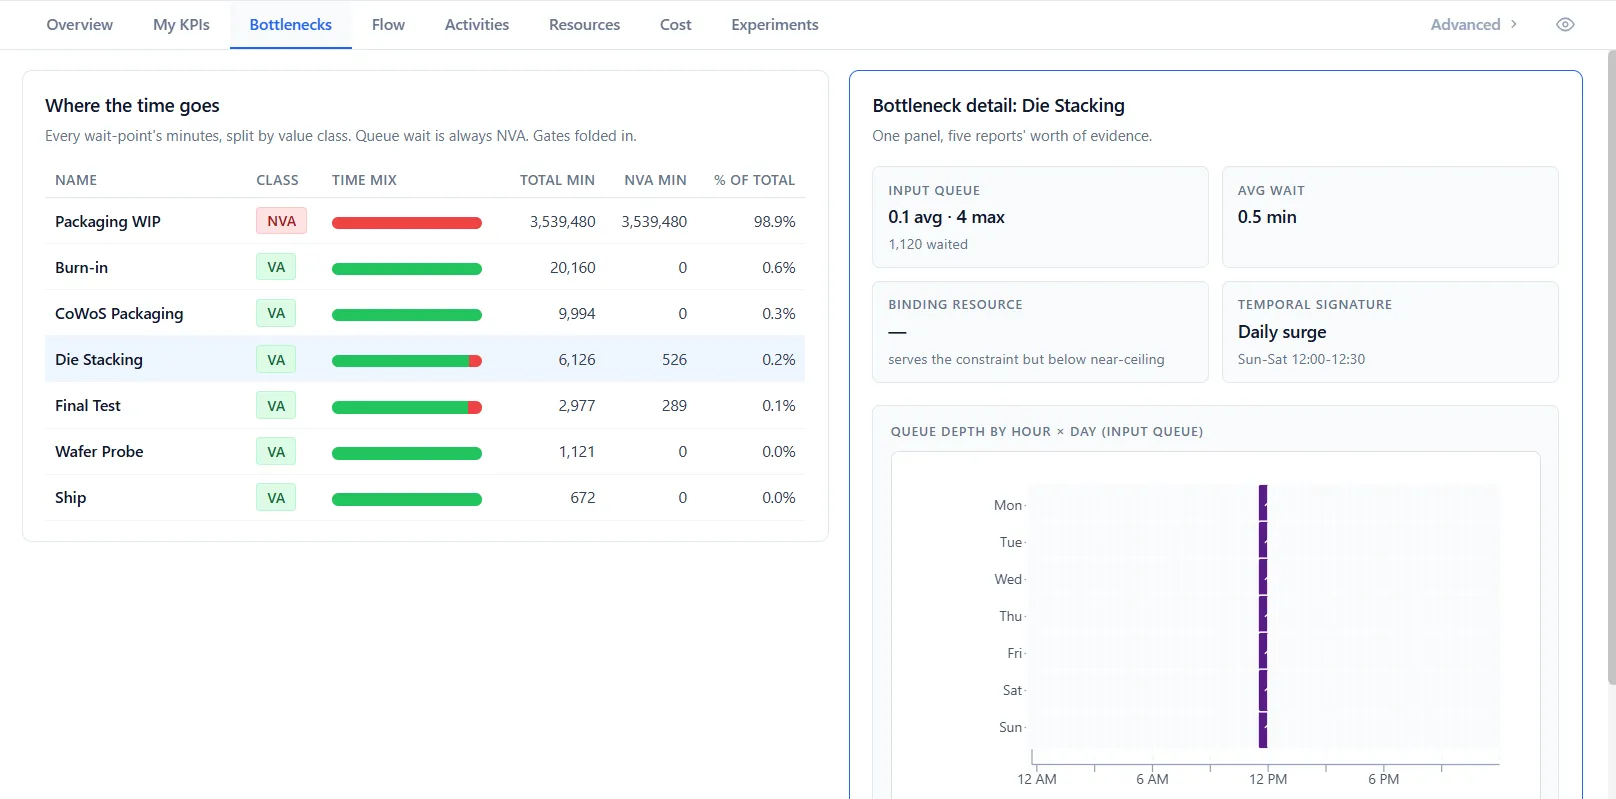
Impact Analysis ranks every step by the time and cost it adds, so the real constraint is obvious. Sort the hotspots, then start with the one that matters most.

Prove the fix
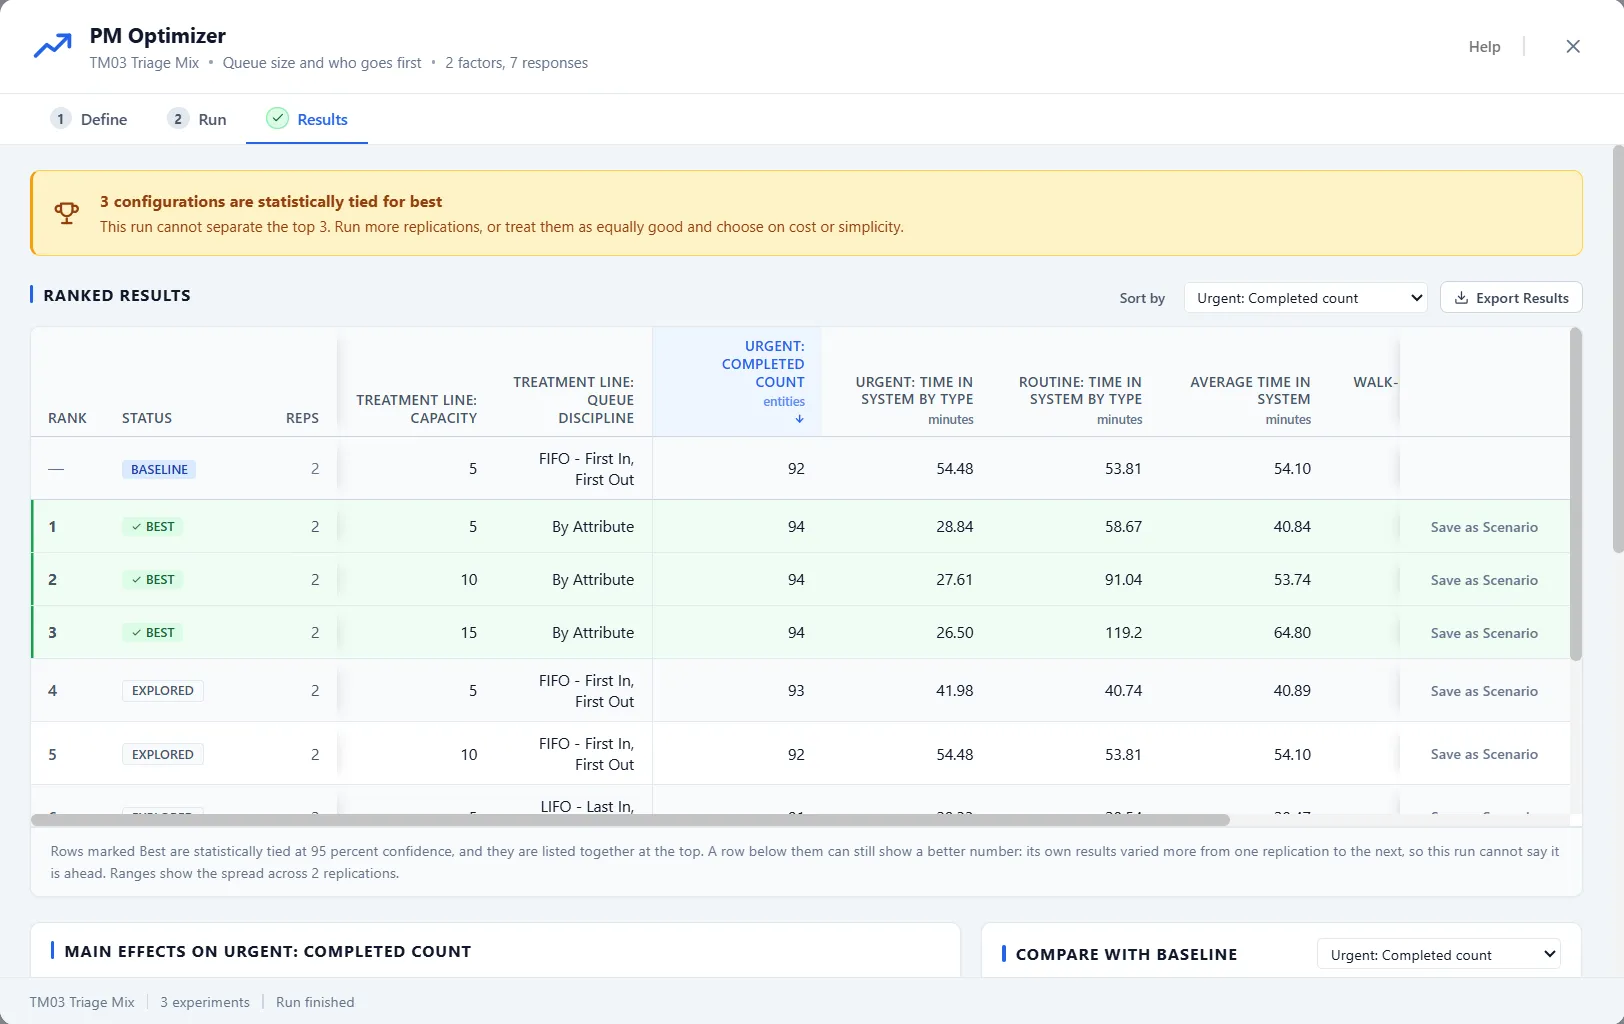
Change a parameter, run again, and compare current versus future state side by side. See exactly how each change performs before you touch the real operation.

Capabilities at a glance
The building blocks for an accurate model, from routing and resources to control logic and cost.
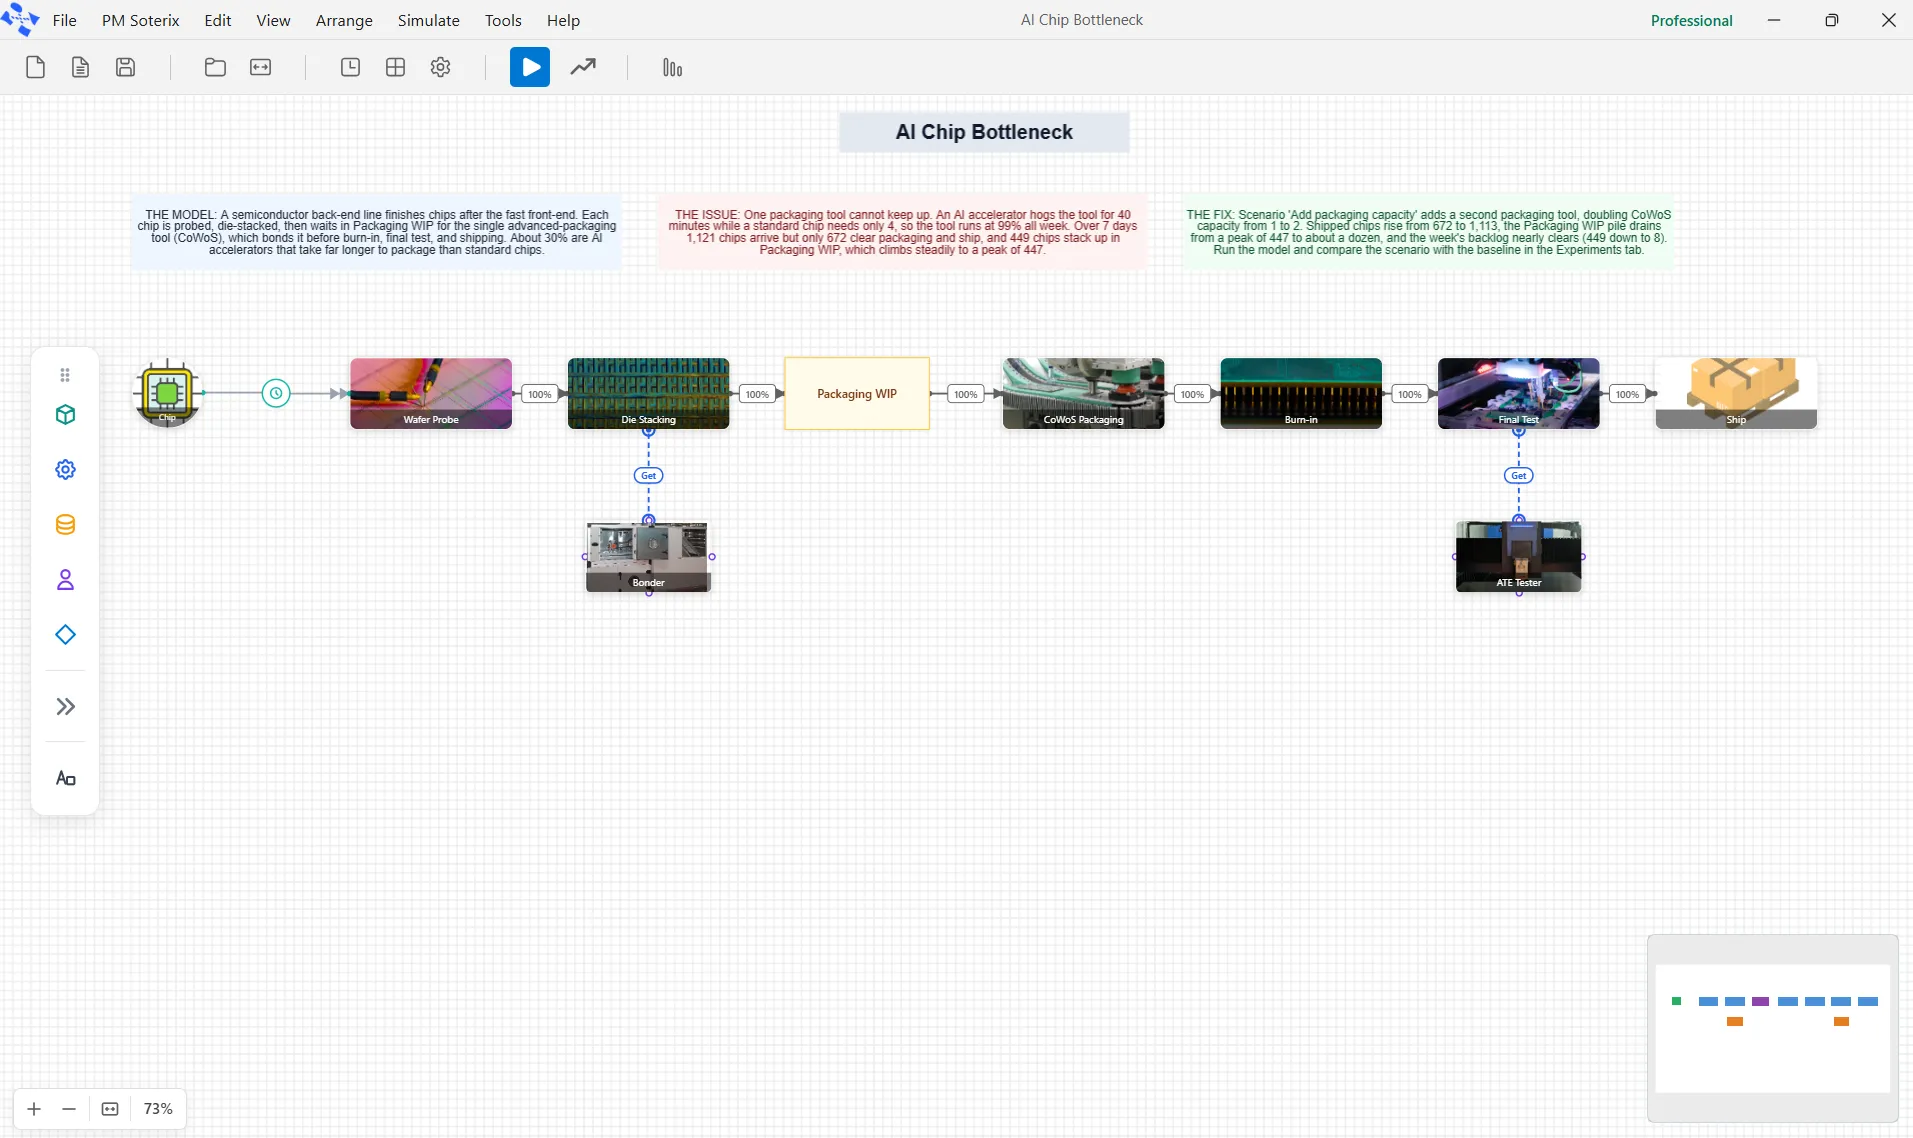
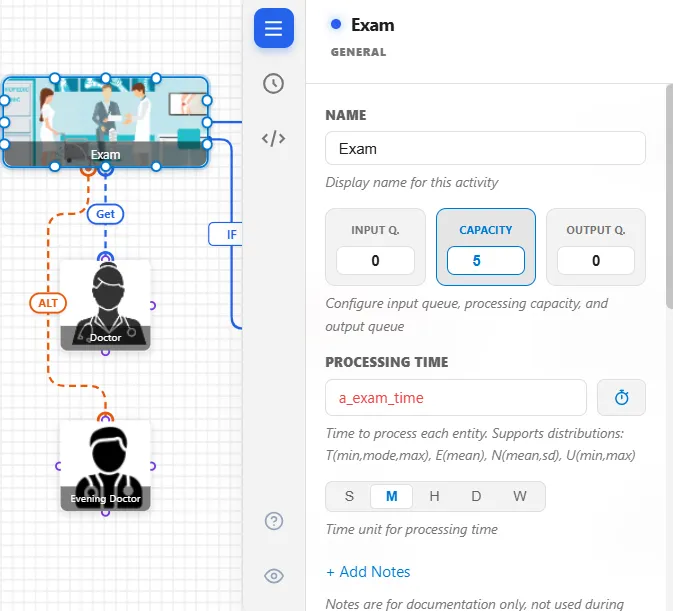
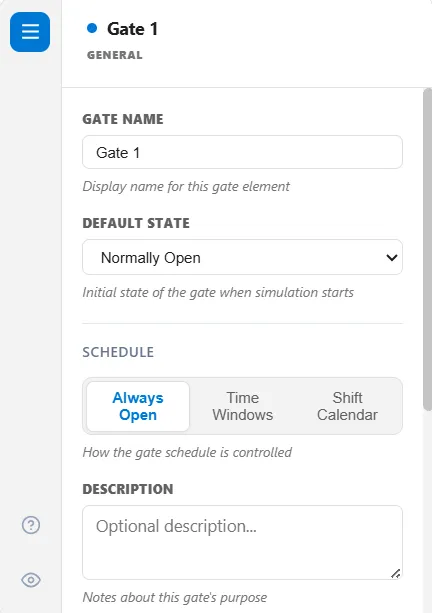
Activities, queues, resources, gates, signals, batching, inventory, and reusable subprocesses on a single canvas.
Percentage, conditional, fork, pull, load balancing, and fallback paths that mirror how work really moves.
Pooled staff and machines, shift presets and custom schedules, breaks, availability, priorities, and travel time.
Finite or unlimited queues, input and output buffers, back-pressure, and disciplines from FIFO to earliest due date.
Batch by count, time, or rule, unbatch with allocation math, and carriers with finite capacity and travel.
Resource, activity, and entity costs with value-added and non-value-added time tracked across every path.
A full discrete-event logic language with variables, attributes, arrays, decision tables, gates, and signals.
Build models from a description, and read live results back in plain language with the bottlenecks called out.
Results that matter
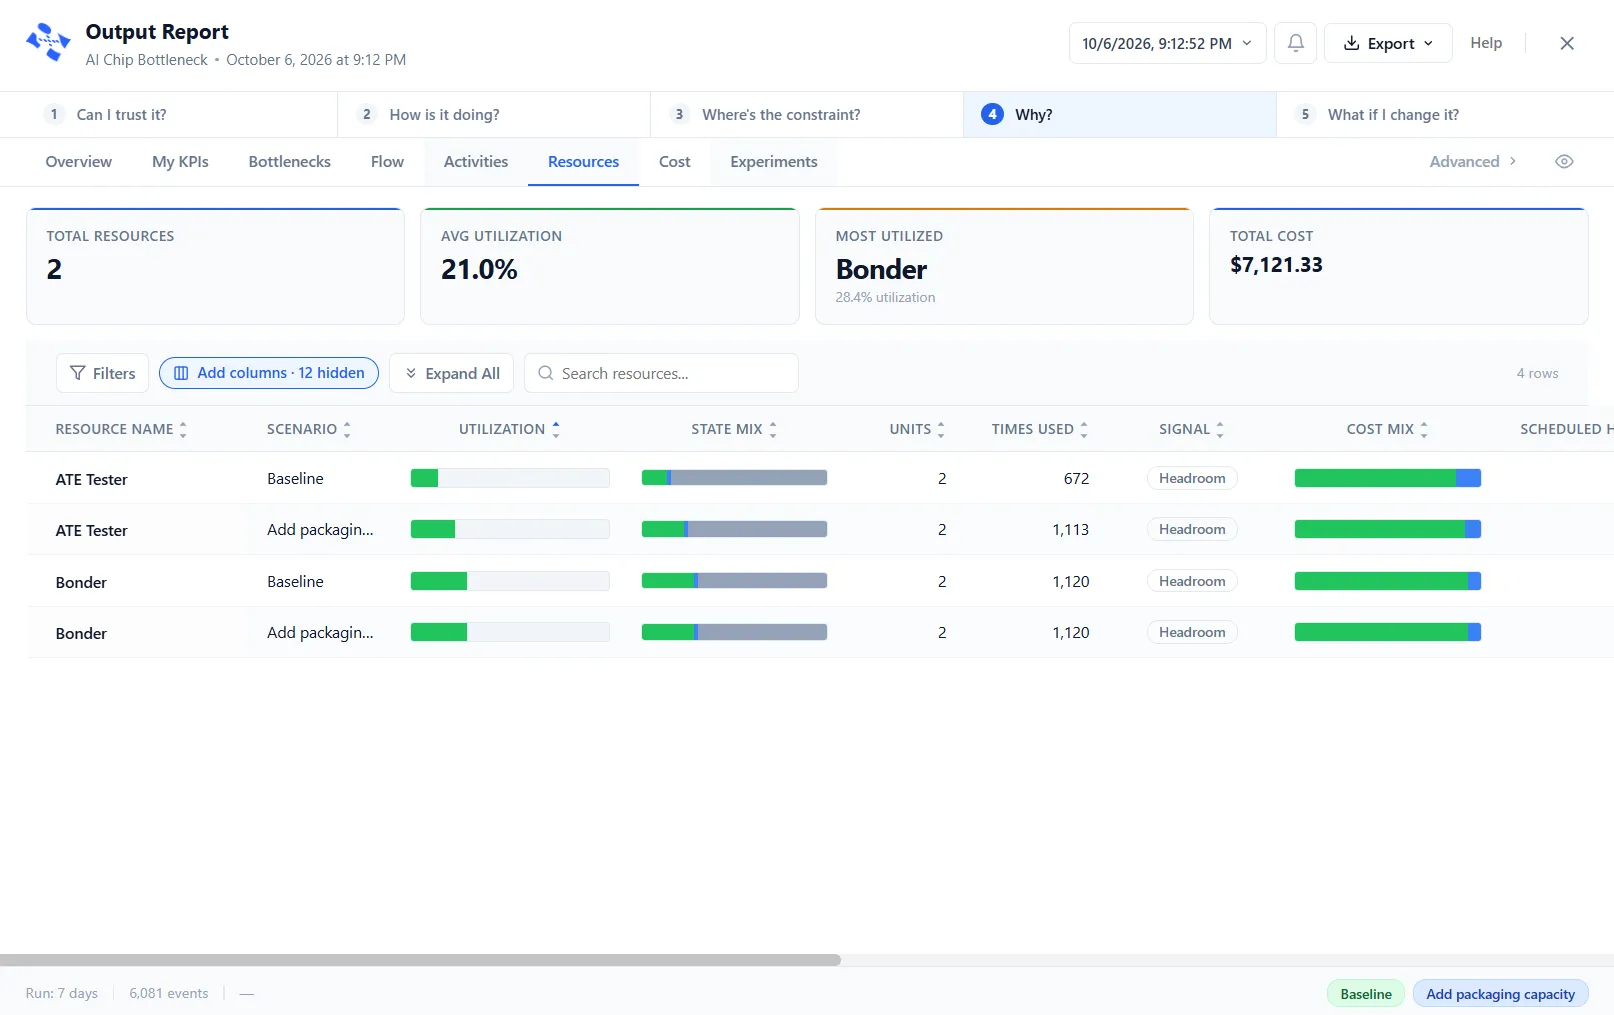
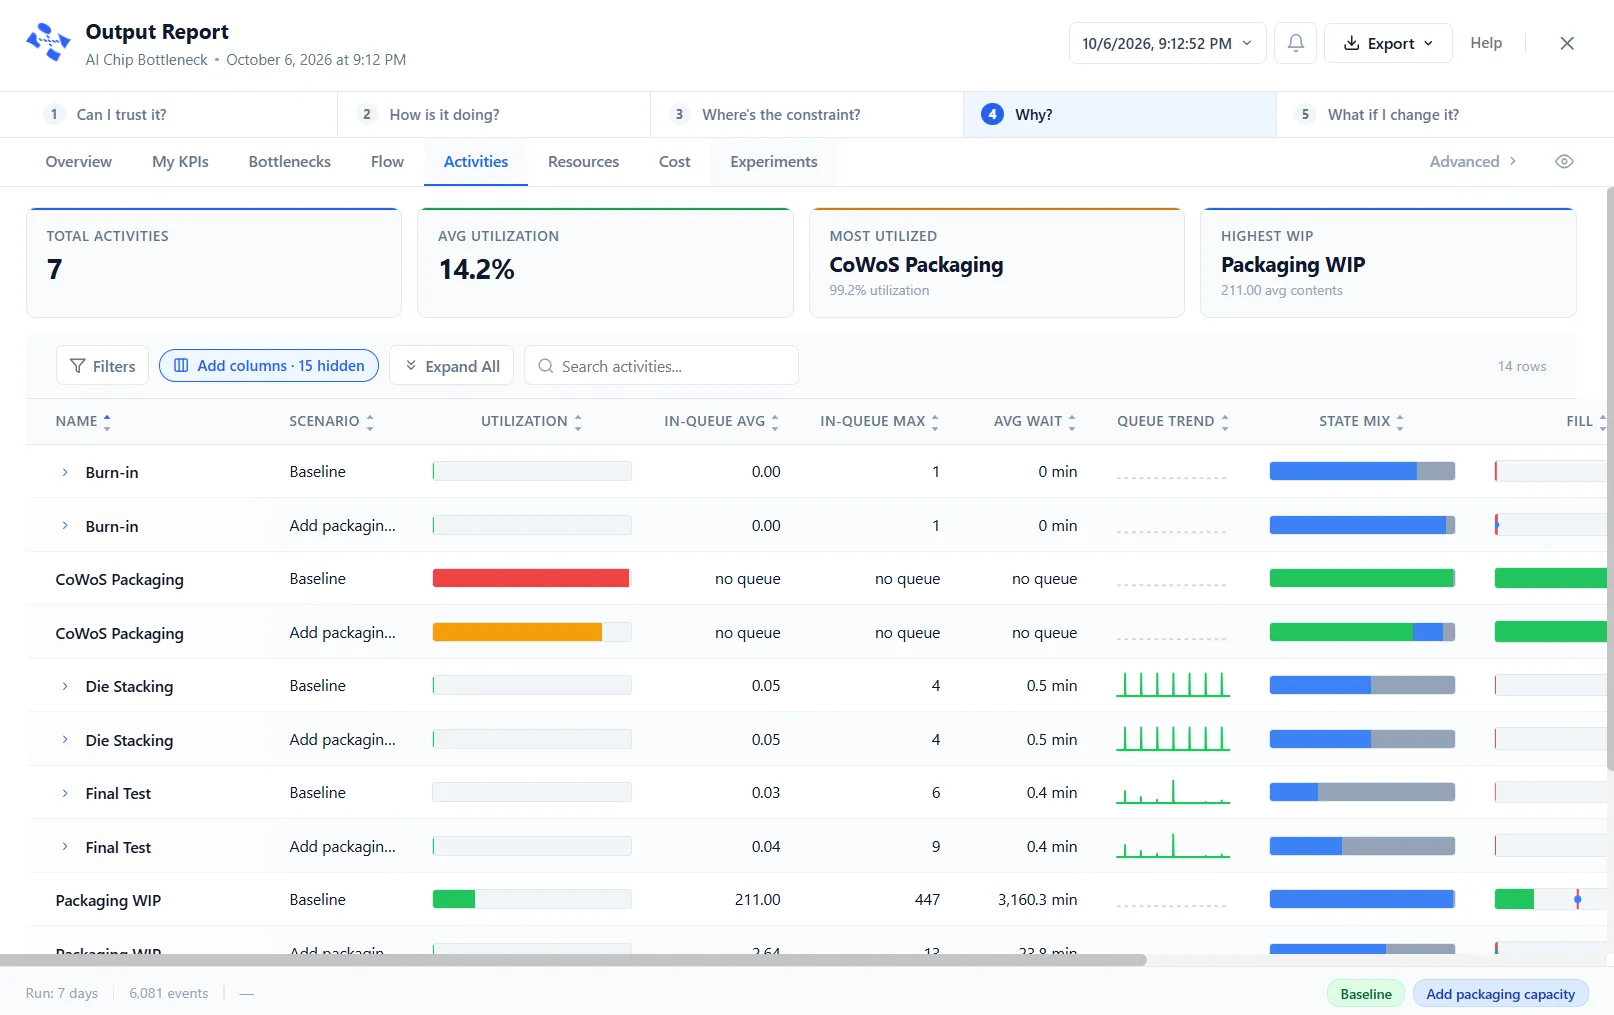
The Output Report after every run: the headline numbers, the resource picture, the real bottleneck, and where queues build.

Throughput, average time in system, the headline bottleneck, and work in process, the moment a run finishes.

See which resources run hot and which sit idle, with a worker here pinned near full utilization.

Impact Analysis ranks every step by the time it adds, so the real constraint stops hiding behind the obvious one.

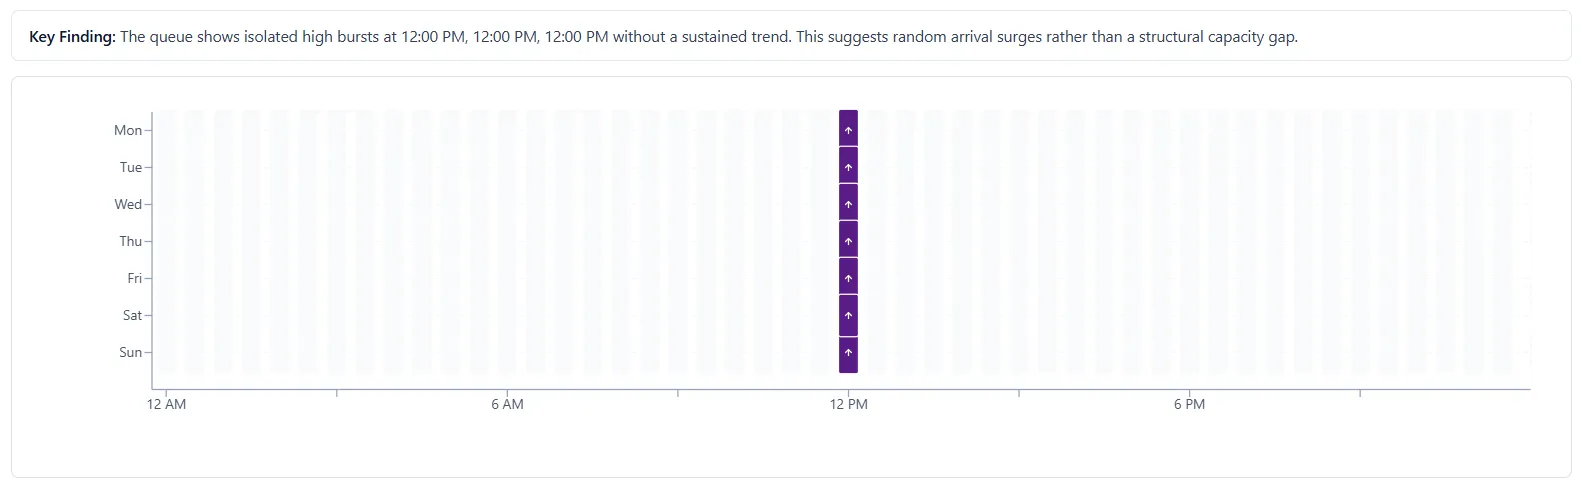
A distinctive view of when and where queues build through the operating window, with the worst hours called out.
Proof
Founded in 1999, ProcessModel has helped Fortune 500 companies save billions across manufacturing, healthcare, consulting, and government.
It was instrumental in helping me change our process to reduce our backlog from 23 days to 2.
Our people thought they would have to hire and train an additional 500 representatives. The modeling pointed out where the real problems were, and how to re-engineer the process with the addition of only 125. That is a 14 million dollar saving.
The product itself is outstanding, the support is great, and the training is awesome. Nationwide Insurance has saved millions using this tool.
Simply the best, cost-effective process analysis tool on the market.


Build the model, run the simulation, find the constraint, and show the improvement before you change a thing.