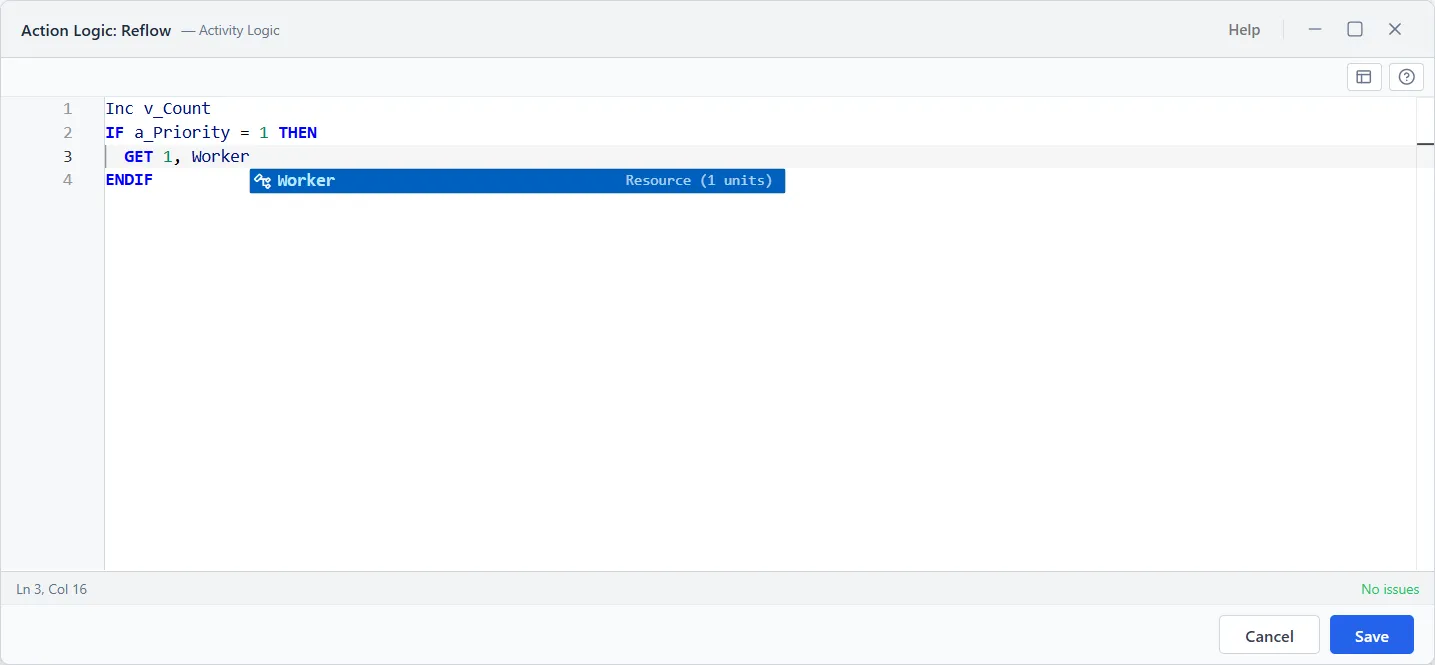
A real control-logic language
Per-step logic with set, increment, conditionals, loops, waits, get and free, and signals, with arrays and attributes, edited inline with highlighting and suggestions.


Technical capabilities
The question for any serious evaluation is simple. Can the tool represent the real complexity of your operation, and can it analyze that model fast enough to support a decision? ProcessModel is built to answer yes to both.
PM AI Bridge and simulation
PM AI Bridge lets your own AI app on this computer control ProcessModel. A real simulation does the rigorous analysis that a decision rests on.
Control and data
You decide when your own AI app can reach ProcessModel, and you can see what it does and stop it.
Visual modeling
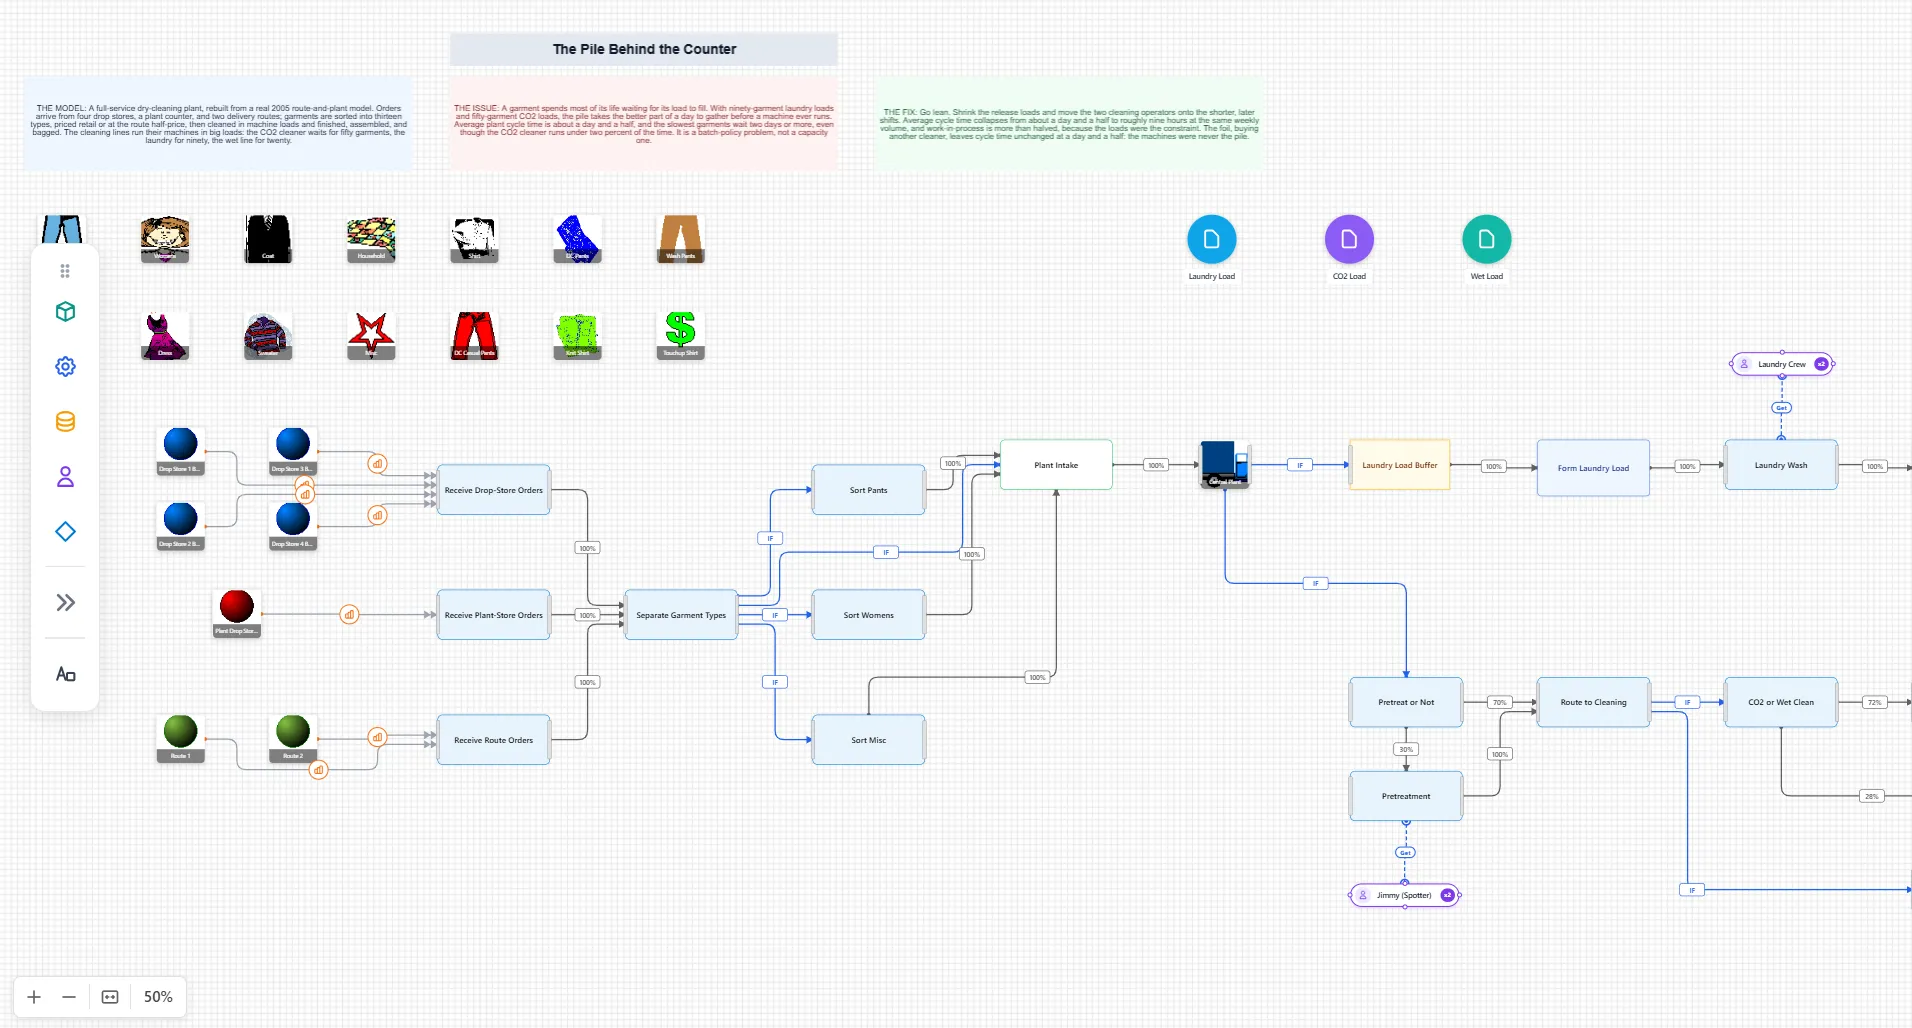
A process is a network of activities, queues, resources, routes, and decisions. You build it that way on the canvas, connecting the steps and the paths so the model reads like the operation it stands for.
As a model grows into dozens of connected steps, one-click automatic layout untangles it for you, so a complex network stays readable instead of turning into a knot of crossing lines.
Rapid experimentation
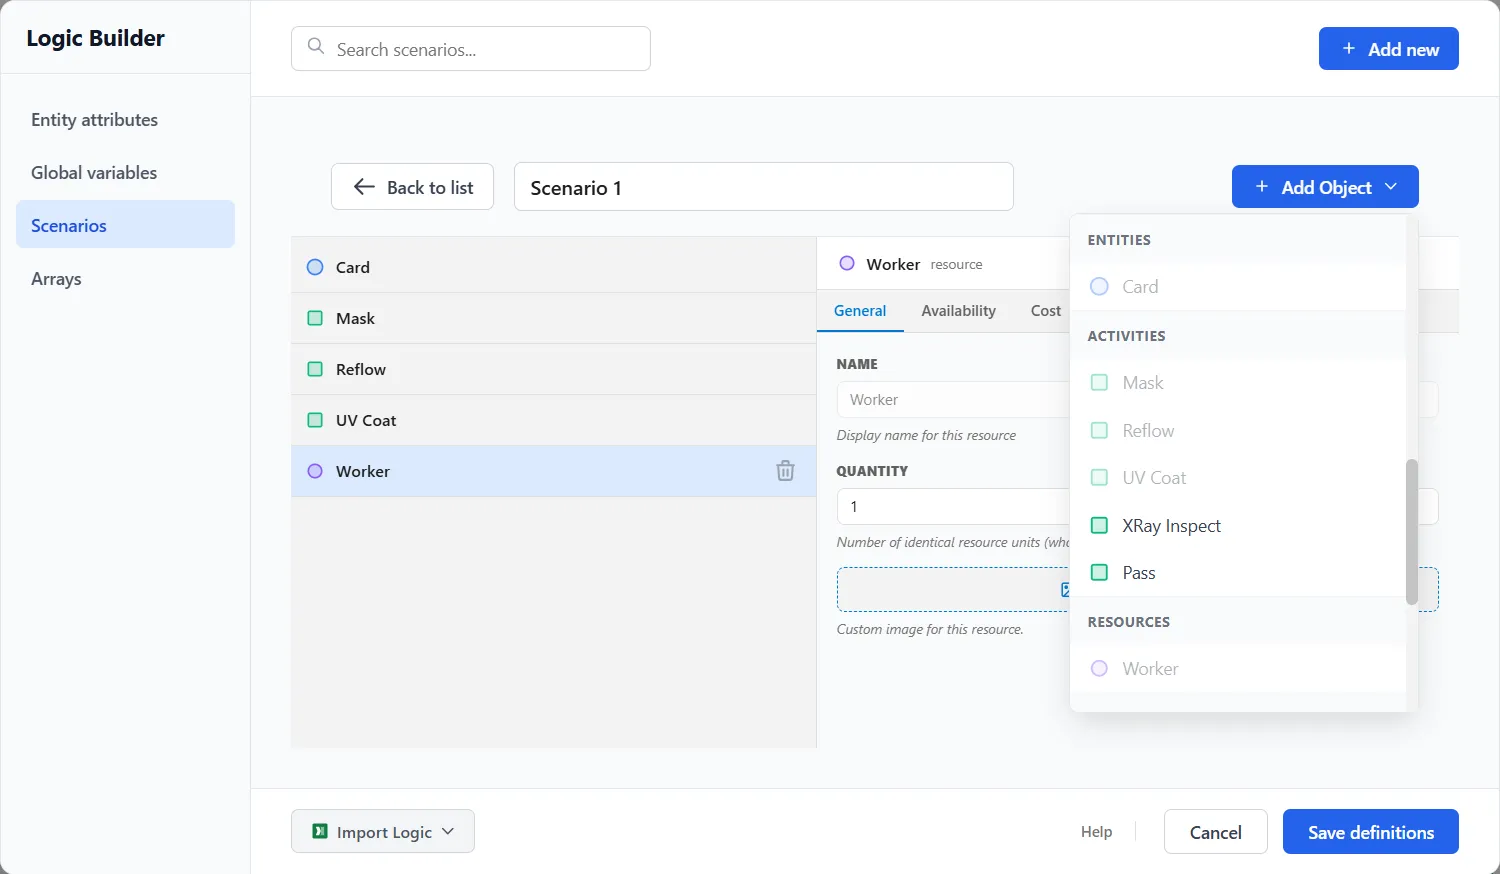
A scenario is a set of changes layered over the base model. Adjust resources, schedules, routing, capacities, and logic, override arrivals, gates, and inventory, then run it and see what happens.
Keep the current state intact and compare it against the future state with measurable results, so every proposed change is backed by numbers rather than opinion.
Performance
Rigorous analysis is only useful if the answer arrives in time to act on it. ProcessModel runs replications and experiments in parallel, so a model with real variability still returns stable numbers quickly.
Many replications of the same model run at once, so the variability settles into reliable averages without a long wait.
Several scenarios run side by side, so a sweep of alternatives is measured together rather than one slow run after another.
High-volume models with real arrivals and queues return confidence intervals across replications fast enough to keep a review moving.
Results you can trust
The engine was reworked for 7.0 so the numbers add up, the clock is respected, and the run tells you when it cannot trust an input instead of guessing.
An activity's operation, waiting, blocked, and idle time each reads as its real share of scheduled time, so utilization never climbs past what the clock allows.
A day expression returns days and a one-week delay runs for a week. A value the run cannot read stops it and names the field, instead of guessing.
Seize a resource in one activity and free it in a later one, and the hold lasts the whole way between, so utilization reads true.
Condition-based routing that once dragged runs in seconds with identical results, and a scenario that fails now fails the run instead of reporting a clean success.
What it can represent
The building blocks for a model that behaves like the real operation, from flow and variability to control logic and cost.
Percentage, conditional, fork, pull, load balancing, attach and detach, renege, and fallback paths that mirror how work really moves.
26 probability distributions, plus distributions fitted from your own observed data, seeded streams for reproducibility, and warm-up periods.
Continuous, periodic, scheduled calendar grids, daily patterns with a 24-hour curve, and order lead time, with bulk import for large arrival files.
Pooled staff and machines, availability and breakdowns, ten shift presets and custom schedules, breaks, overtime, priorities, travel time, and caseload for continuity of care.
Finite or unlimited queues, input and output buffers, back-pressure and blocking, and disciplines from FIFO to earliest due date.
Batch by count, timeout, schedule, or rule, with selection rules, attribute aggregation, nested batching, unbatch math, and carriers with finite capacity.
Aggregated stock, multiple items, zones and locations, unit costs, storage capacity, reorder levels, substitution, and FIFO or LIFO consumption.
Gates and signals plus a per-step discrete-event language with variables, attributes, and one, two, and three dimensional arrays, and decision tables.
Resource, activity, entity, and per-move costs, with value-added, required non-value-added, and non-value-added time tracked across every path.
Type, custom attributes, carrying capacity, parent and child links, age, time in system, accumulated time and cost, and live status, all queryable in expressions.
Collapsible sub-models and process groups, callable subprocesses, asynchronous exit, input and output mapping, and high-volume capacity.
Calendar-accurate schedules that honor the Start Day, weekly shifts with presets and custom, breaks, multi-shift and around-the-clock, and schedule connections that open and close on the calendar.
Per-step logic with set, increment, conditionals, loops, waits, get and free, and signals, with arrays and attributes, edited inline with highlighting and suggestions.
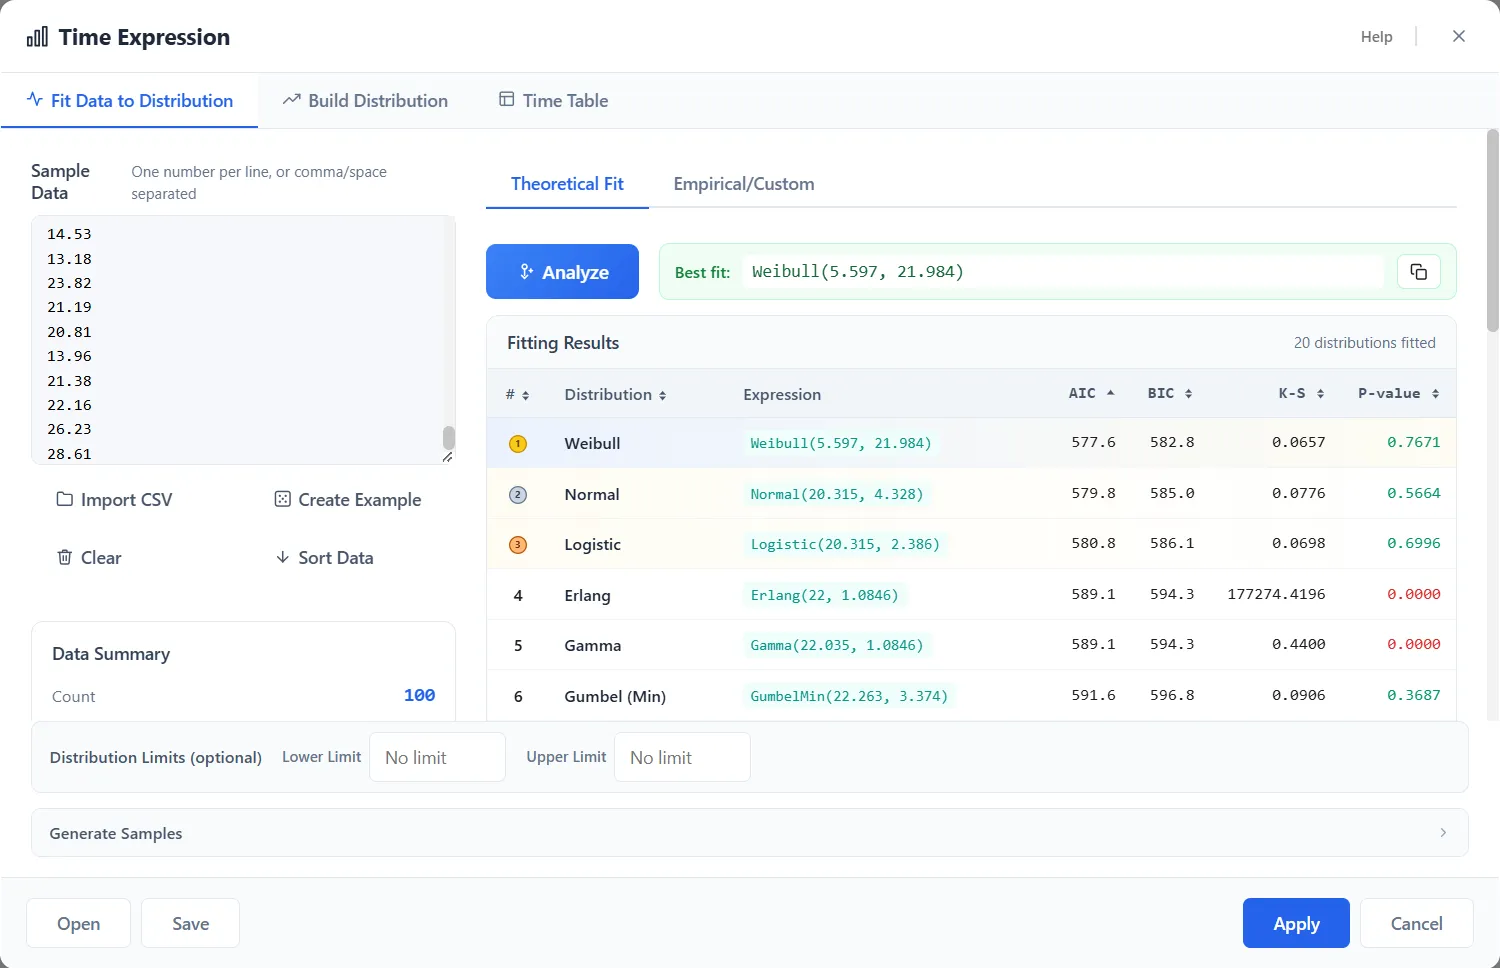
Choose from 26 distributions, or paste your own observed data and let the tool rank the best fit, so timing reflects reality instead of a convenient guess.
Results and analysis
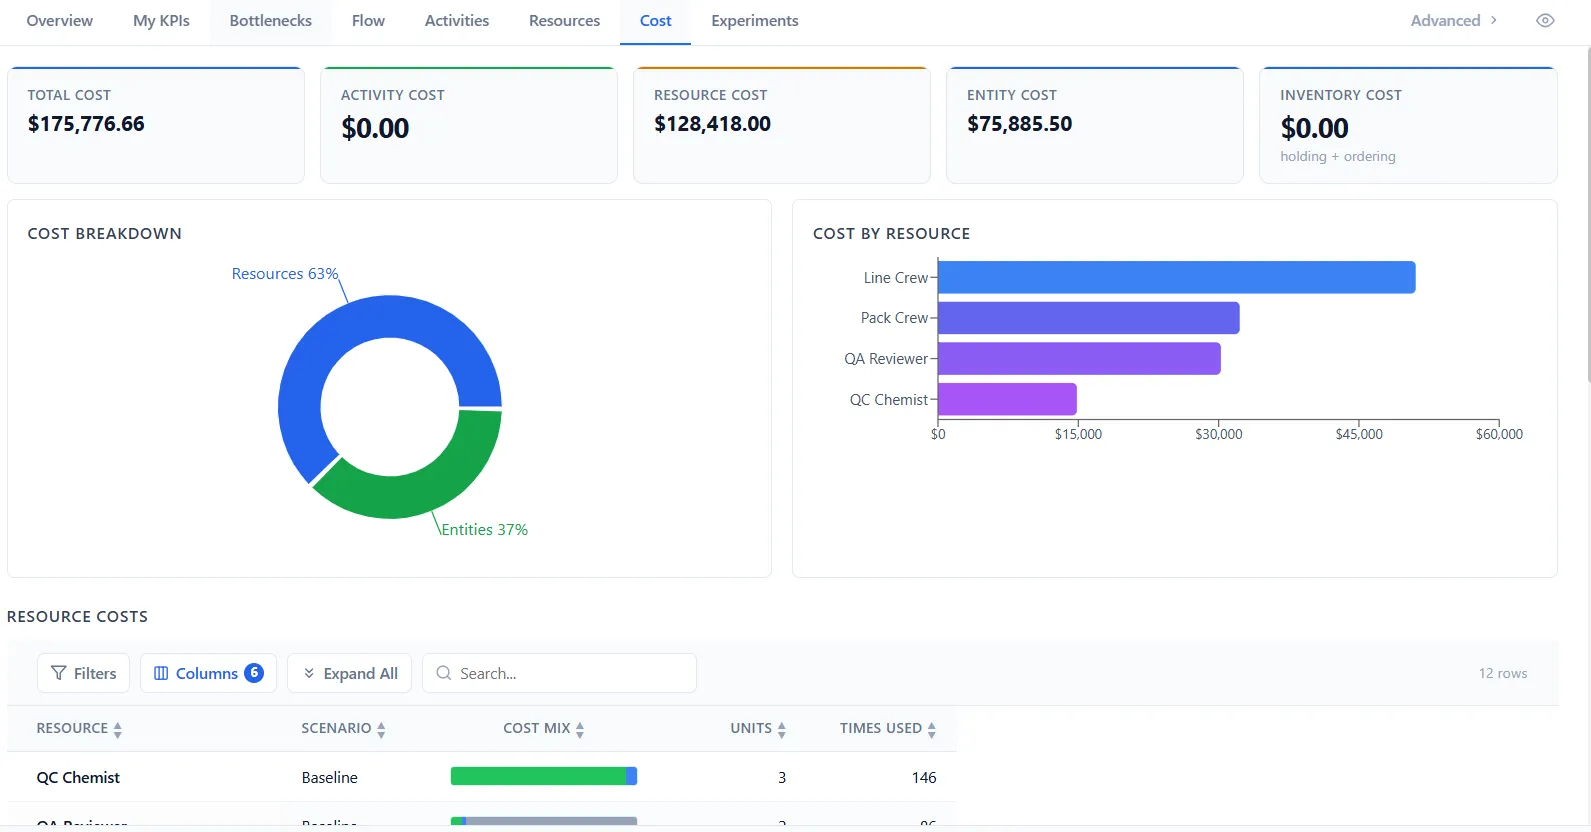
Every run produces a full report. The Cost tab shown here breaks down where money goes by resource, activity, entity, and inventory, with a value-stream split of value-added and non-value-added time, alongside the rest of the model in its own tab.
Overview, My KPIs, Bottlenecks, Flow, Activities, Resources, Cost, and Experiments, with impact, queues, routes, variables, and analysis rules a click away under Advanced.
Every wait point is ranked by the minutes it adds, split into value-added and non-value-added, and each queue's weekly pattern is read to name the cause behind it.
A distinctive view of where and when queues form through the operating window, with the worst hours called out.
Cost by resource, activity, and entity, with value-added and non-value-added time, and inventory holding and ordering cost, charted and exportable.
Expand a tracked variable to see every run on its own, or average it across all of them with a median, a min and max, a standard deviation, or a 90, 95, or 99 percent confidence band.
Proof
Founded in 1999, ProcessModel has helped Fortune 500 companies save billions across manufacturing, healthcare, consulting, and government.
Our people thought they would have to hire and train an additional 500 representatives. The modeling pointed out where the real problems were, and how to re-engineer the process with the addition of only 125. That is a 14 million dollar saving.
The most easy to learn, most powerful, and most useful simulation and modeling software for transactional processes.
Build the network, model the variability, write the logic, run it in parallel, and read the results. The detail you need to trust the answer, with the speed to act on it.