

Features
Everything you need to map, simulate, and improve a process
From drag-and-drop modeling to discrete-event simulation, bottleneck analysis, and a full results report, every ProcessModel feature points at the same goal: see the work clearly, then prove the fix before you change the real operation.
Everything in one tool
Map it, model it, prove it
ProcessModel brings process mapping, a real discrete-event simulation engine, and clear analytics together, so one tool takes you from a sketch of the process to a decision you can defend.
Build the model fast
Go from a blank canvas to a working model in minutes
Lay the model out by hand, or let your own AI app work in it through PM AI Bridge. Either way, you are modeling the real operation in minutes, not wrestling with the tool.
PM AI Bridge
Let your own AI app on this computer control ProcessModel: read and check the model, change anything a person can, run it and read the results. It is off until you turn it on.
Drag-and-drop canvas
Place activities, queues, resources, gates, and routes on one visual canvas, so the model reads like the operation it stands for.
One-click automatic layout
Untangle a large model into a clean, readable diagram automatically, with no manual arranging and no crossing lines to chase.
Demo models and objects
Start from ready-made models and reusable building blocks, then adapt them to your own process instead of beginning from scratch.
Reusable subprocesses
Collapse detail into callable process groups, so a sprawling operation stays readable and the big picture stays in view.
Properties at your fingertips
Configure any object in a properties panel beside the canvas, with timing, resources, routing, costs, and logic all in one place.
Model reality, not a cartoon
Capture how work actually moves, varies, and waits
A model is only useful if it behaves like the real thing. ProcessModel represents the variability, the resources, the queues, and the routing that make an operation what it is.
True-to-life routing
Percentage, conditional, fork, pull, load balancing, attach and detach, renege, and fallback paths that mirror how work really moves.
Demand and arrivals
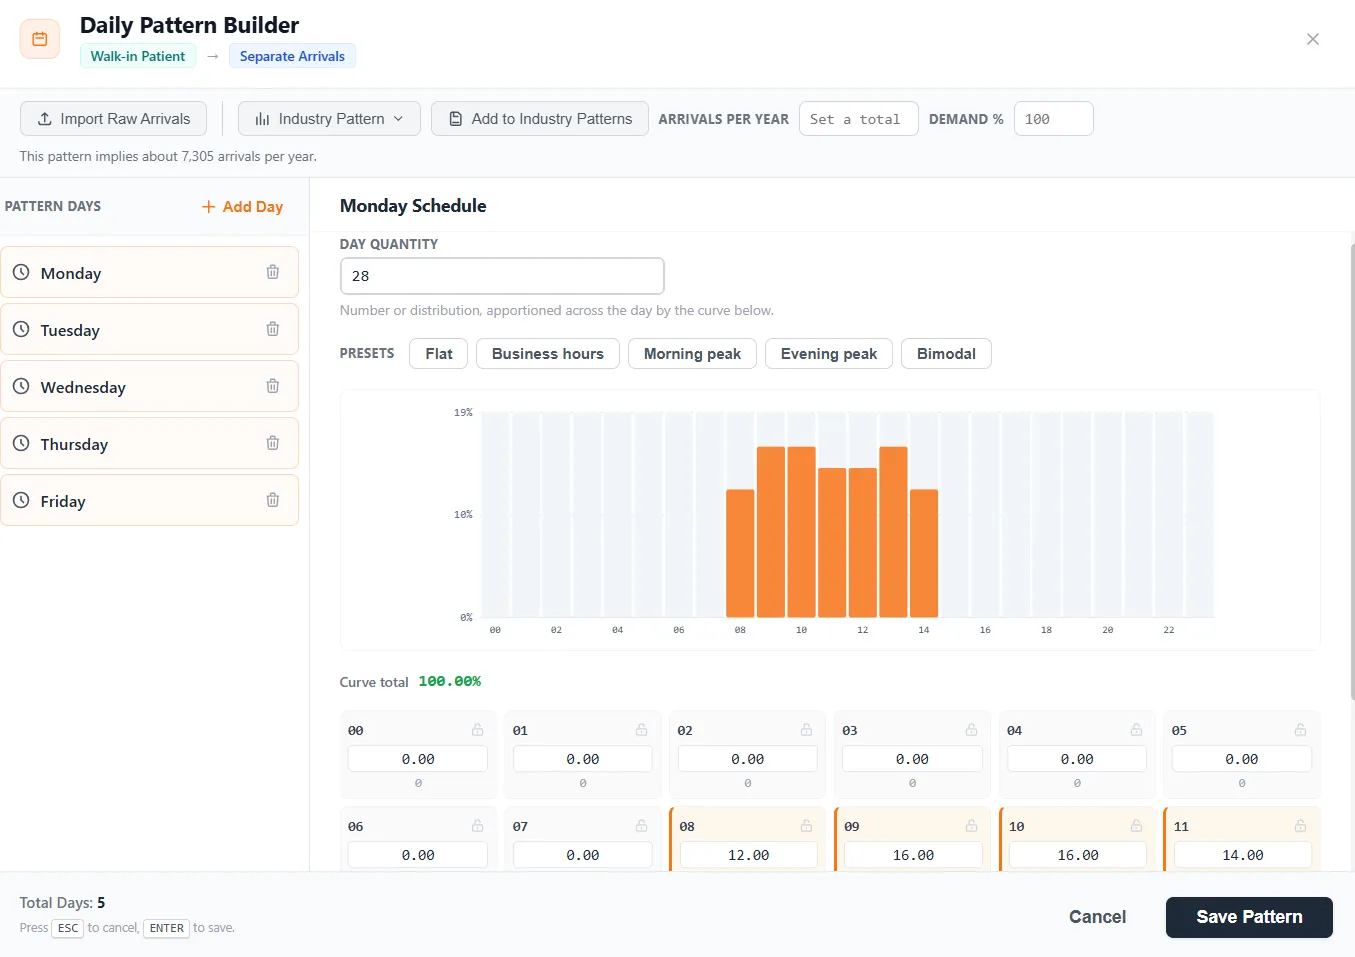
Continuous, periodic, scheduled calendar grids, daily patterns with a 24-hour curve built from your own history, and order lead time, with bulk import for large arrival files.
Variability from your data
Choose from 26 probability distributions, or fit a distribution to your own observed data, so timing reflects reality instead of a guess.
Resources and shifts
Pooled staff and machines, availability and breakdowns, ten shift presets and custom schedules, an activity Shift tab, breaks, overtime, priorities, and travel time.
Caseload and Track Board
Bind a case to one worker who serves it on every visit, cap the cases and workload each can carry, hand off at shift change, and watch it live on the Track Board.
Queues and blocking
Finite or unlimited queues, input and output buffers, back-pressure and blocking, and disciplines from FIFO to earliest due date.
Batching and material handling
Batch by count, timeout, schedule, or rule, with selection rules, attribute aggregation, nested batching, unbatch math, and carriers with finite capacity.
Inventory and materials
Aggregated stock, multiple items, zones and locations, unit costs, storage capacity, reorder levels, substitution, and FIFO or LIFO consumption.
Capture the rules that run your operation
Encode the policies, costs, and decisions behind the flow
Real operations run on rules. Write them once and the simulation respects them on every entity, on every run.
A real control-logic language
Per-step logic with variables, conditionals, loops, waits, get and free, and signals, edited inline, where you can create a variable or attribute without leaving the field.
Gates and signals
Time-window, shift, kanban-pull, WIP-limited, and rate-limited gates, with signals to coordinate flow across the model.
Process Tables
Drive routing and behavior from readable tables, where a row takes a full condition that combines several attributes and variables at once rather than a single test.
Variables, attributes, and arrays
Track model state and per-entity attributes, with one, two, and three dimensional arrays you can increment or decrement a single cell at a time.
Cost and value stream
Resource, activity, entity, and per-move costs, with value-added, required non-value-added, and non-value-added time across every path.
Prove the change before you make it
Test the future state and back every decision with numbers
Change a parameter, run again, and compare. The result arrives before you touch the real operation, so every proposed change is backed by evidence.
Scenario comparison
Layer changes over the base model, adjust resources, schedules, routing, and capacities, override arrivals, gates, and inventory, then compare current versus future state side by side.
PM Optimizer
Go past one what-if: vary the settings you choose, measure the results you care about, and let PM Optimizer search for the configuration that wins, then save it as a scenario.
Parallel replications
Run many replications of the same model at once, so variability settles into reliable averages without a long wait.
Experiments, weighed for you
Run a sweep of scenarios side by side, then read the Experiments tab, which weighs them and says in words what improved, what it cost, and where the constraint moves next.
Reproducible runs
Seeded streams, warm-up periods, and bounded resampling, with confidence bands across replications at 90, 95, or 99 percent you can trust and repeat.
Get answers you can act on
A clear report after every run, with the bottleneck called out
A simulation is only as good as the answer it gives back. ProcessModel turns a run into a report you can act on, with the constraint named in plain language.
Output Report
Overview, My KPIs, Bottlenecks, Flow, Activities, Resources, Cost, and Experiments, with more under Advanced, and confidence intervals across replications at 90, 95, or 99 percent.
Answer-first Overview
The Overview names your constraint in plain language, and a trust banner tells you whether to believe the numbers before you read one.
Bottlenecks
Every wait point ranked by the minutes it adds, split by value class, with each queue's weekly pattern read to name the cause behind it.
Queue Diagnostics heatmap
A distinctive view of where and when queues build through the operating window, with the worst hours called out.
Export and animation
Excel and text export, live KPI cards during the run, and animation to watch the work move through the process.
Feature spotlight
Build a daily arrival pattern from your own data
Real demand has a rhythm, busier on some weekdays than others, with peaks at certain hours. Paste a column of date and time stamps and ProcessModel reads how many arrived on each weekday, fits a distribution to each, and builds an hour-by-hour curve from the real arrival times.
- Paste a column of time stamps, up to a hundred thousand rows.
- Accept its fit for each day, or pick a different one, and adjust the curve by hand.
- Plan for growth: enter the arrivals you expect in a year and the week rescales to match.
Go deeper
See it in action, or get into the detail
The feature list above is the what. These two pages are the how, from the four-step workflow shown with the app to the full technical breakdown.
The product at a glance
The problem, the approach, and the four-step workflow, build the model, run the simulation, find the bottleneck, and prove the fix, shown with the running app.
See how it worksTechnical capabilities
Twelve domains of operational detail, the 26 distributions, the control logic language, and the performance to analyze a complex model fast, for a thorough evaluation.
Explore the technical detailsProof
Built to handle real operations
Founded in 1999, ProcessModel has helped Fortune 500 companies save billions across manufacturing, healthcare, consulting, and government.
It was instrumental in helping me change our process to reduce our backlog from 23 days to 2.
The most easy to learn, most powerful, and most useful simulation and modeling software for transactional processes.









See the whole toolkit at work
Build the model, run the simulation, find the constraint, and prove the improvement before you change a thing.