

Queue Diagnostics
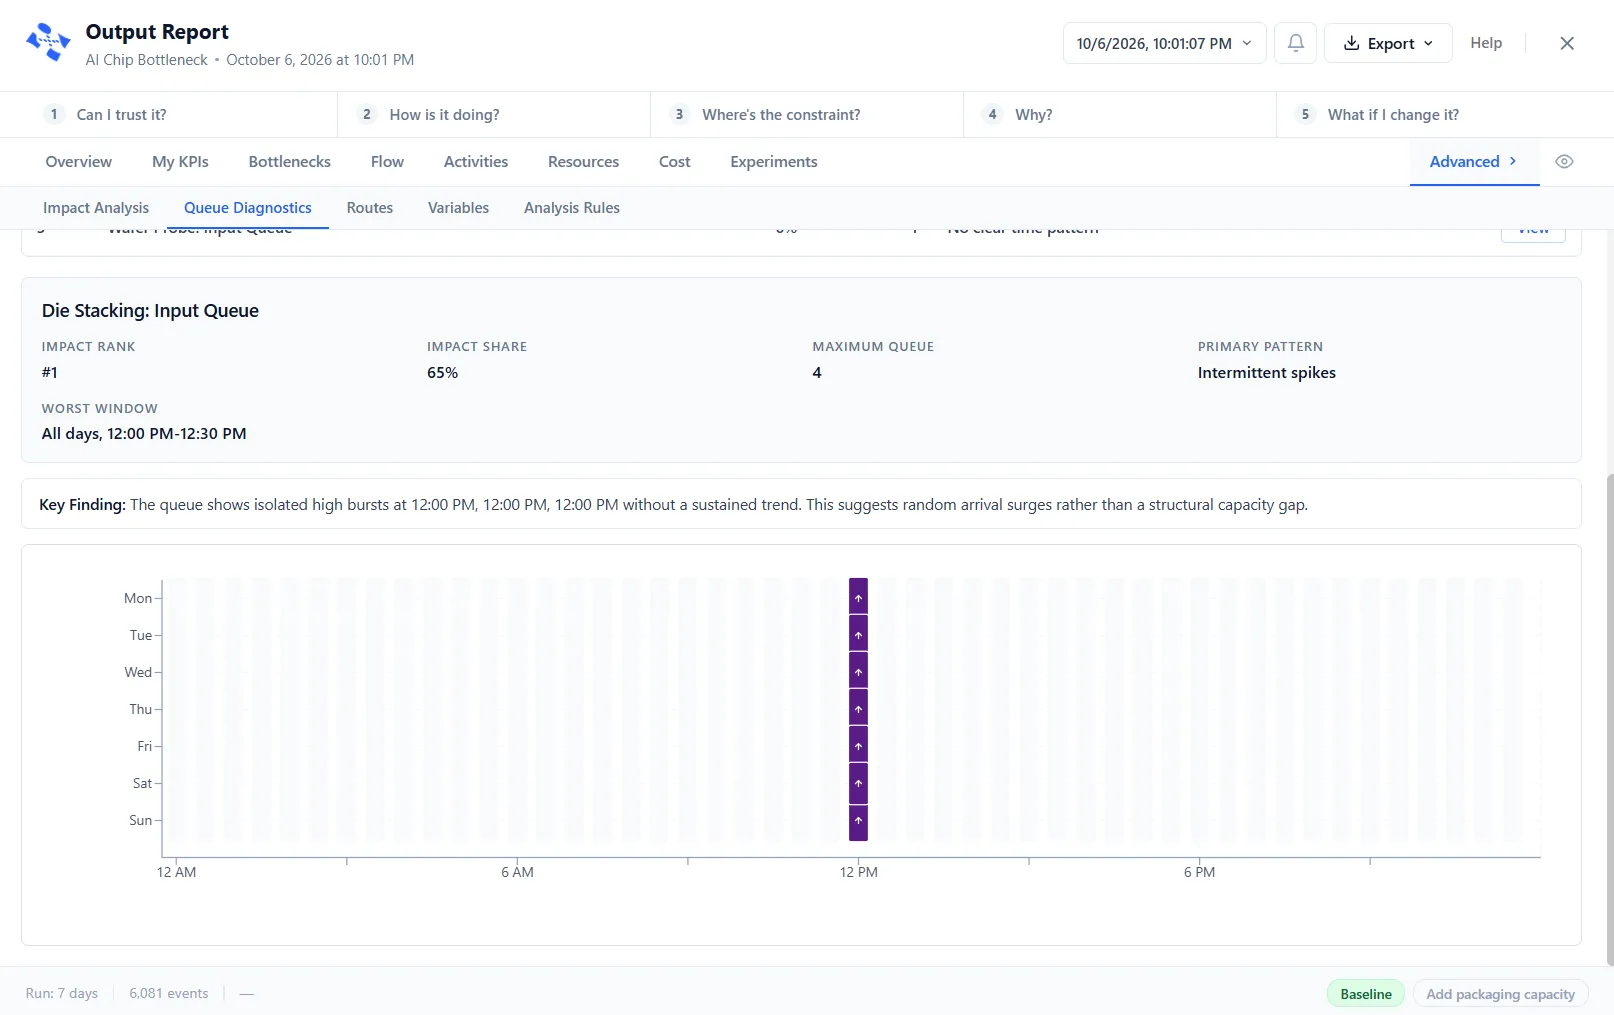
Queue Diagnostics shows where and when work piles up in your model, so waiting problems are easy to spot.
Reading the heatmap
Section titled “Reading the heatmap”The tab lists the queues with the biggest waiting problems, and shows a heatmap of the week: each cell is a time of day on a day of the week, colored by how congested that queue was. Colored bands reveal when work backs up, so you can see whether a queue is always busy or only at certain hours. The colors run from yellow through orange and red to dark purple as the queue gets worse, and an up arrow marks a cell where the queue was growing. The rows start on the run’s Start day (Monday unless you set another, see Simulation Options) and run on in order, so a run that starts on a Wednesday reads Wednesday to Tuesday.
Queue Diagnostics needs bucket collection turned on. Without it, the tab has nothing to show.
Bucket collection
Section titled “Bucket collection”Bucket collection is what fills the heatmap. Rather than recording every change in a queue’s length, ProcessModel keeps a weekly grid of half-hour cells, seven days by forty-eight, lined up with the calendar from the start of the run. Each cell accumulates what happened in that half hour on that day of the week, every week of the run.
For each cell it keeps the time-weighted average queue length, how long the cell was actually observed, the longest and shortest the queue got, how many entities entered and left, and, for a gate’s queue, how many minutes the gate was open.
Sampling is driven by entities rather than by a timer: an entry or an exit records the span since the last event, spread across every cell that span crosses. A queue with nothing happening in it costs nothing to watch.
Four kinds of queue are collected: a standalone Queue node, an activity’s input queue, its output queue, and a gate’s waiting queue. They appear separately in the tab, so you can tell a full input queue from a blocked output queue.
Turning it on
Section titled “Turning it on”Two levels, and the more specific one wins.
- The master setting is the On / Off switch Queue bucket collection in the Advanced group of Simulation Options. It is on by default, so most models need nothing else.
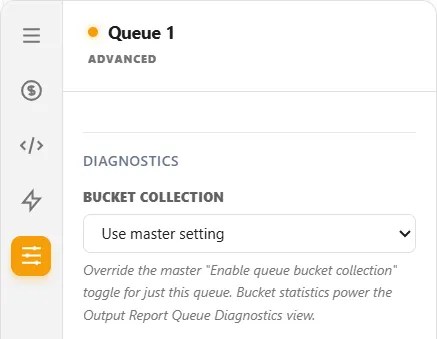
- The per-queue setting is Bucket Collection on a Queue node’s Advanced tab, with three choices: Use master setting, On, and Off. Use it to watch one queue in a model where collection is off, or to leave one out.
What it costs
Section titled “What it costs”The grid itself is small and, more usefully, bounded: it is the same 336 cells whether the run is a week or a year, because the weeks wrap onto each other. The cost that does grow with run length is the run-axis series recorded alongside it, which is not bounded by the grid. On a very long run with many queues that is the one to think about, and switching collection off for queues you are not investigating is the way to control it.