

How do I change the look and feel of Smart Stats?
This article is from the previous version of ProcessModel and is kept for reference.
LegacyHow this worked in the previous version
Global customization
Section titled “Global customization”Customize the look of all reports using the Theme icon from the ribbon. Fonts, colors, and accents all change to popular and tested themes.
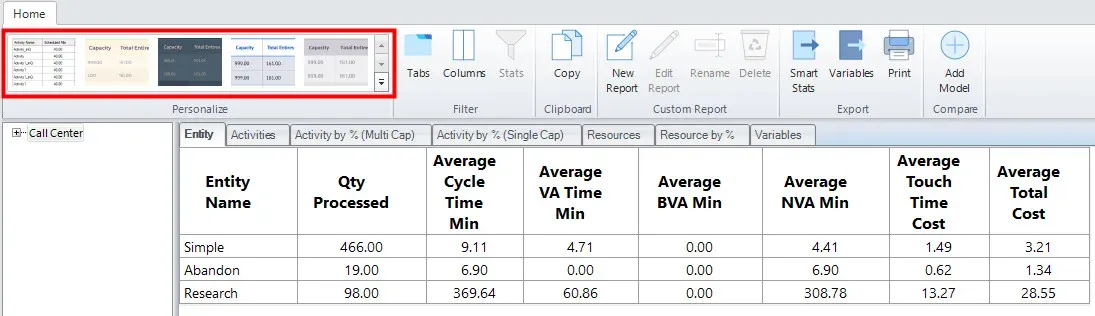
Change the look and feel of every object in the Smart Stats program.
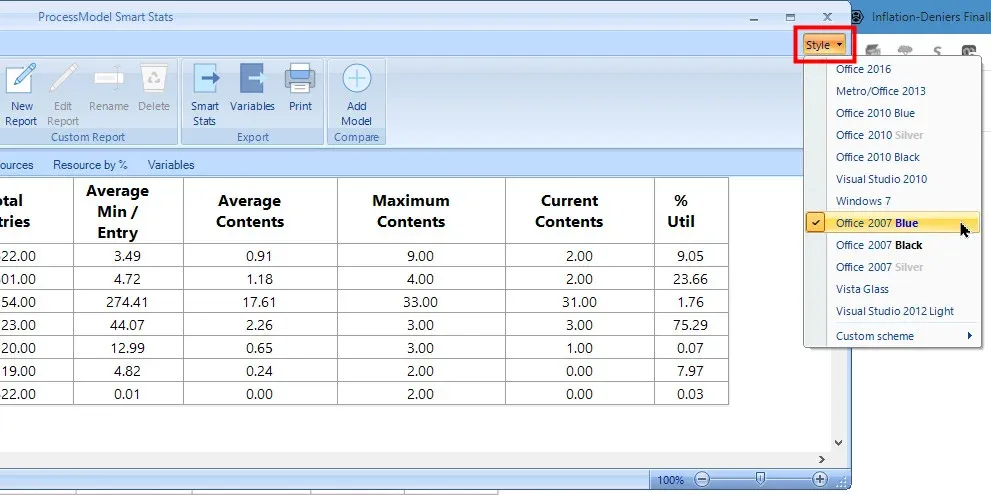
Modify Smart Stats program colors using the style menu on the far right.
Reports selection
Section titled “Reports selection”Use the Tabs Icon to hide any irrelevant report categories. For example, if your model doesn’t include resources, then showing resource reports would be confusing, so hide these.
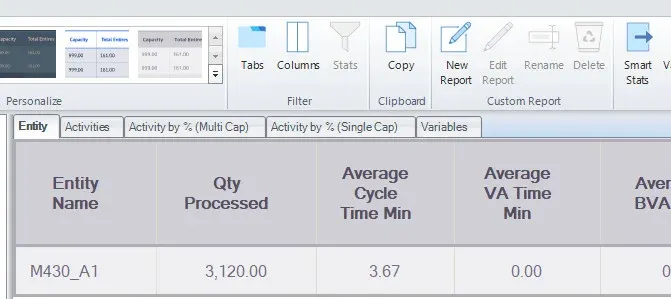
The above image shows the remaining tabs after removing some standard reports.
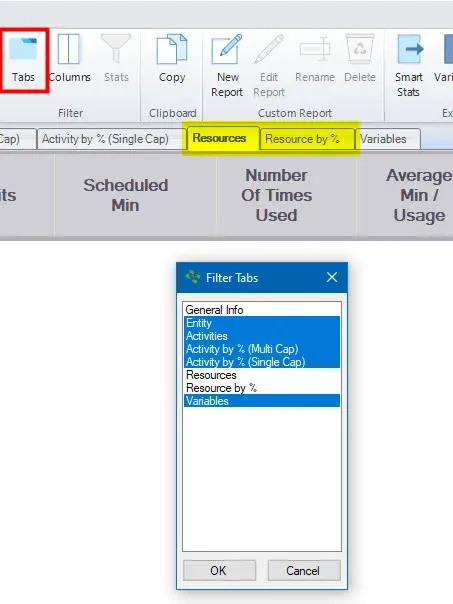
Remove irrelevant reports using the Tabs icon.
Rearrange the tabs by dragging a tab into a new position. Show the information in the order necessary for your presentation.
Columns selection
Section titled “Columns selection”Use the Column Icon to hide any statistics column not crucial to your goal. For example, if you decided not to include the cost or RNVA in the model build, showing these columns provides no useful information.
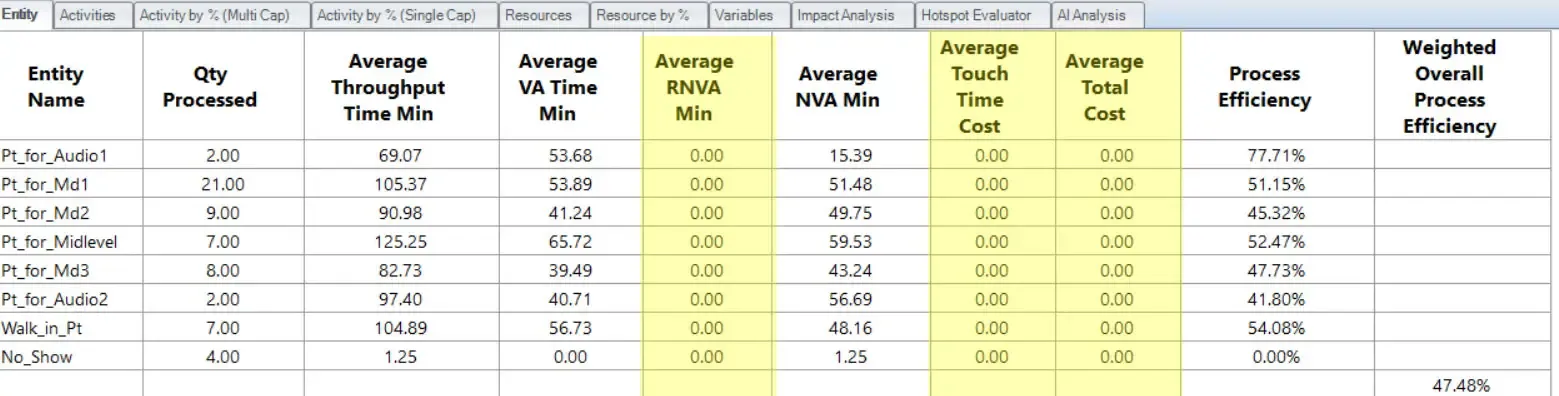
For this model, the highlighted columns don’t add value.
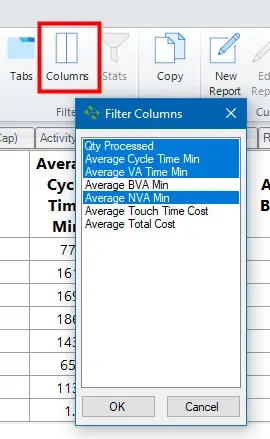
The columns filter allows irrelevant information to be hidden from the report.
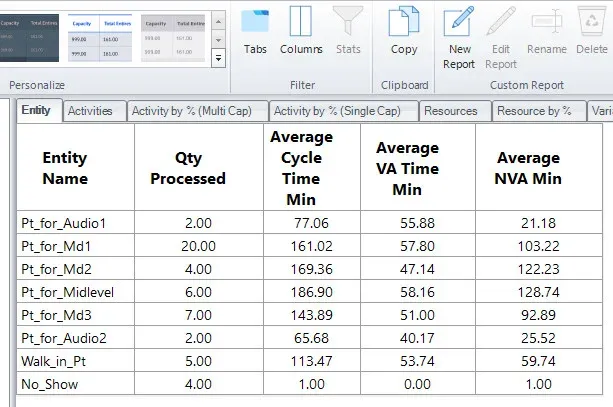
Report with relevant columns remaining.
Sorting
Section titled “Sorting”Names appear on the output report in the order of how you placed them on the layout. Alphabetize the names by clicking on the header. All columns sort using this same method. This technique quickly identifies critical information in many reports.
Additional stats
Section titled “Additional stats”After running replications, use the Stats icon in the ribbon to enable additional information, such as the Min and Max…confidence intervals, etc.
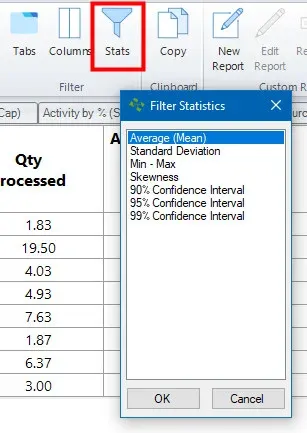
Additional statistic options are available after running replications.