

Define an experiment
Define is the first step in PM Optimizer, where you lay out the experiment: what to vary, what to measure, and what best means.
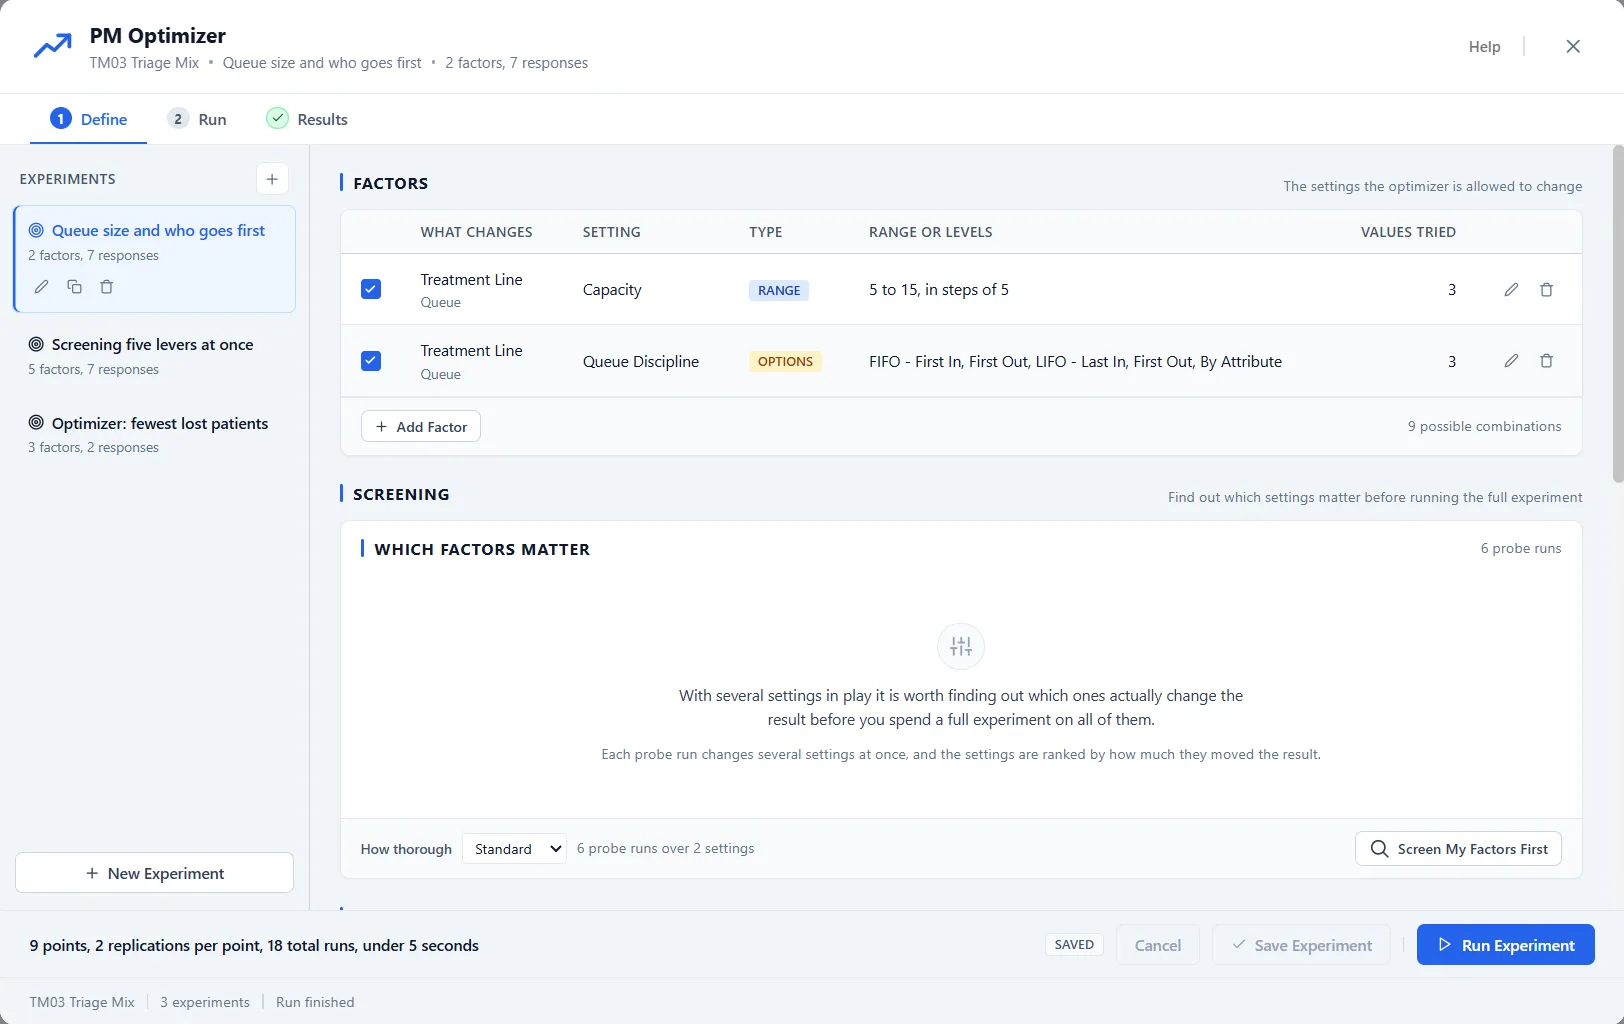
The step reads top to bottom: the factors table, a screening panel that finds which factors matter, the responses list, and the design choice. Each has its own article; this one covers the experiment list, the goal, limits, and the footer that starts the run.
One model, many experiments
Section titled “One model, many experiments”The list on the left holds every experiment saved with this model. Each one is independent, with its own factors, responses, and goal, so you can keep a quick screening study next to a full optimization and switch between them. Use New Experiment to start another, and the pencil, copy, and trash icons to rename, duplicate, or remove one. Give each a plain name that says what it asks, such as “Queue size and who goes first”.
The goal: what best means
Section titled “The goal: what best means”Every response you measure carries a goal: Lower is better, for something you want less of, such as time in system or cost, or Higher is better, for something you want more of, such as throughput. One response wears the Primary badge and leads the search.
When more than one response counts, give each a weight so they combine into a single score. A higher weight pulls the search harder toward that response. A response you leave out, by clearing its checkbox, drops out of the experiment: it is not measured and not shown in the results.
Limits keep results sensible
Section titled “Limits keep results sensible”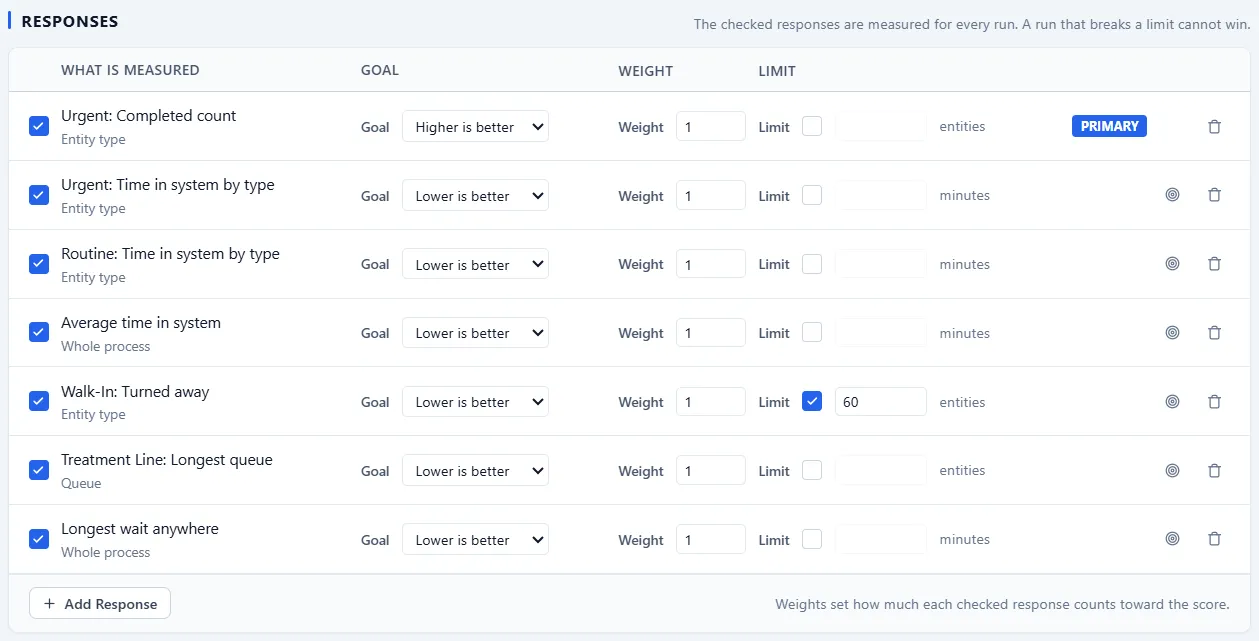
Each response row also carries a Limit: tick the box and type the number. The direction follows from the goal, so there is nothing else to set: where lower is better, the limit is a ceiling the result must stay under; where higher is better, it is a floor the result must stay above. One limit per response.
A configuration that breaks a limit still runs and is still reported, but it cannot win: it is marked over the limit, left out of the ranking, and drawn as a hollow point on the charts so you can see where the boundary sits.
The run footer
Section titled “The run footer”The bar along the bottom does the arithmetic before you commit. For a Full Factorial design it reads, for example, “9 points, 2 replications per point, 18 total runs, under 5 seconds”: how many design points, how many replications per point, the total number of runs that adds up to, and, once a run has been observed, about how long it will take. For the default Smart Optimizer it reads, for example, “Up to 200 runs (up to 100 points at 2 replications each), up to about 7 seconds”, because that search is bounded by its run budget. A second line says “The time is an estimate priced from the screening runs.” once screening has run, or says why Run Experiment is grayed out. Replications themselves are set with the slider on the Full Factorial design card.
The button on the right starts the run. It reads Run Experiment, or Save & Run Experiment when you have unsaved edits, because a run always executes the saved definition. A run that would take a while asks first, so a heavy grid never starts by surprise.
Why Run Experiment is gray
Section titled “Why Run Experiment is gray”The line at the left of the footer gives the first reason the run cannot start. It can read:
- “A process group in this model has “Run on Separate FEL” turned on. Experiments cannot run with that setting.” Turn the setting off on the process group to run the experiment.
- “Measuring today’s output first. Run Experiment unlocks when it finishes.” or “Measuring today’s output. Run Experiment unlocks when it finishes.”, while the experiment measures your current output.
- “Screening is running: N of M probe runs done. Run Experiment unlocks when it finishes.”
- “A simulation is running. Wait for it to finish before running an experiment.”
- “An experiment is already running.”
Only one engine run goes at a time. While a simulation runs, Run Experiment waits, and while an experiment runs, Simulate refuses: “An experiment is running. Stop it in the PM Optimizer before simulating.” When none of these applies, the line names the first problem in the definition, which you can fix on this step.