

ProcessModel 7 Self Teach GuideChapter 11
Chapter 11. Find Where Your Customers Really Wait
By the end of this chapter you can
Find where customers really wait, and why, in the Output Report.
Before you start
In Chapter 10 the shop ran ten Mondays and the report said the run could be trusted. Now read what those ten Mondays say. This chapter changes nothing in the shop. It is about reading: the skill that turns a model into an answer.
A good report reading follows a fixed order, and the Output Report is built around it. Across its top are five questions, the five any manager asks about a process:
- Can I trust it? Before you believe a number, check the run behind it.
- How is it doing? The headline figures.
- Where’s the constraint? The one place that holds everything else back.
- Why? The cause, not just the symptom.
- What if I change it? The fix, tried before you make it.
This chapter answers the first four. Chapter 12 answers the fifth. Keep one question in mind throughout: where do customers really wait, and why? In Chapter 9 you might have guessed the answer is Repair, or the parts. The report will tell you otherwise.
You need your Phone Repair Shop from Chapter 10, with ten replications set (or the practice model below), and about twenty minutes. Every tab is described in full in the Output Report help.
Step 1. Run ten Mondays and open the report
- On the Welcome screen, under Recent Models, click Phone Repair Shop.
- Click Run Simulation. The ten replications run in a few seconds.
- When Simulation Complete asks, click Yes. The Output Report opens on its Overview.
Step 2. Can I trust it, and how is it doing?
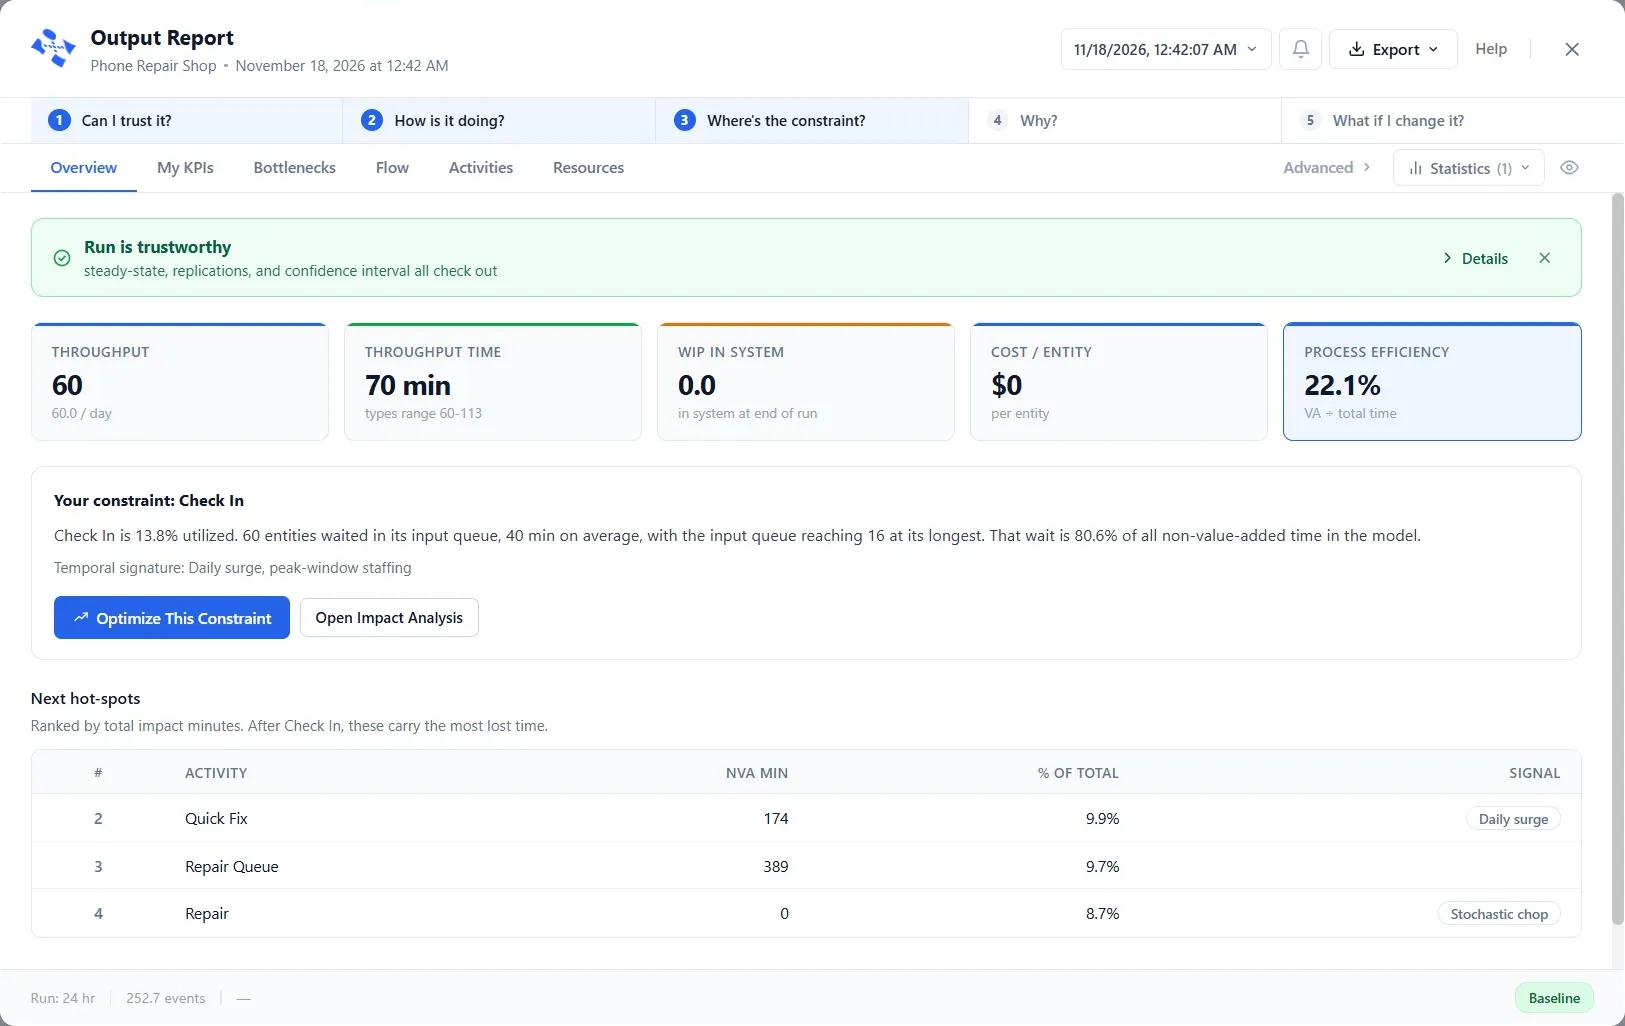
Can I trust it? The green banner says yes: there are enough replications, and they agree. Always look here first. A red or amber banner means the figures below it are not yet safe to act on.
How is it doing? Each figure is the average of ten Mondays. Throughput 60: every customer is served. Throughput Time 70 minutes. And Process Efficiency 22.1%: only about a fifth of a customer’s time in the shop is spent being worked on. The other four fifths is waiting. That is the size of the prize.
Step 3. Where’s the constraint?
Read the box under the figures: Your constraint: Check In. Customers wait there about 40 minutes on average, and its line reaches 16 at its longest.
Stop and notice how surprising that is. Check In is the quickest step in the shop, two to five minutes, with no staff. Nobody would guess it is the problem by looking at its settings. The model found it by watching where the time goes.
Under it, Next hot-spots lists where the most time is lost after Check In: Quick Fix, with 174 minutes lost, then the Repair Queue, then Repair, with none lost: Repair is in the list for its work, not for waiting.
- Click Open Impact Analysis.
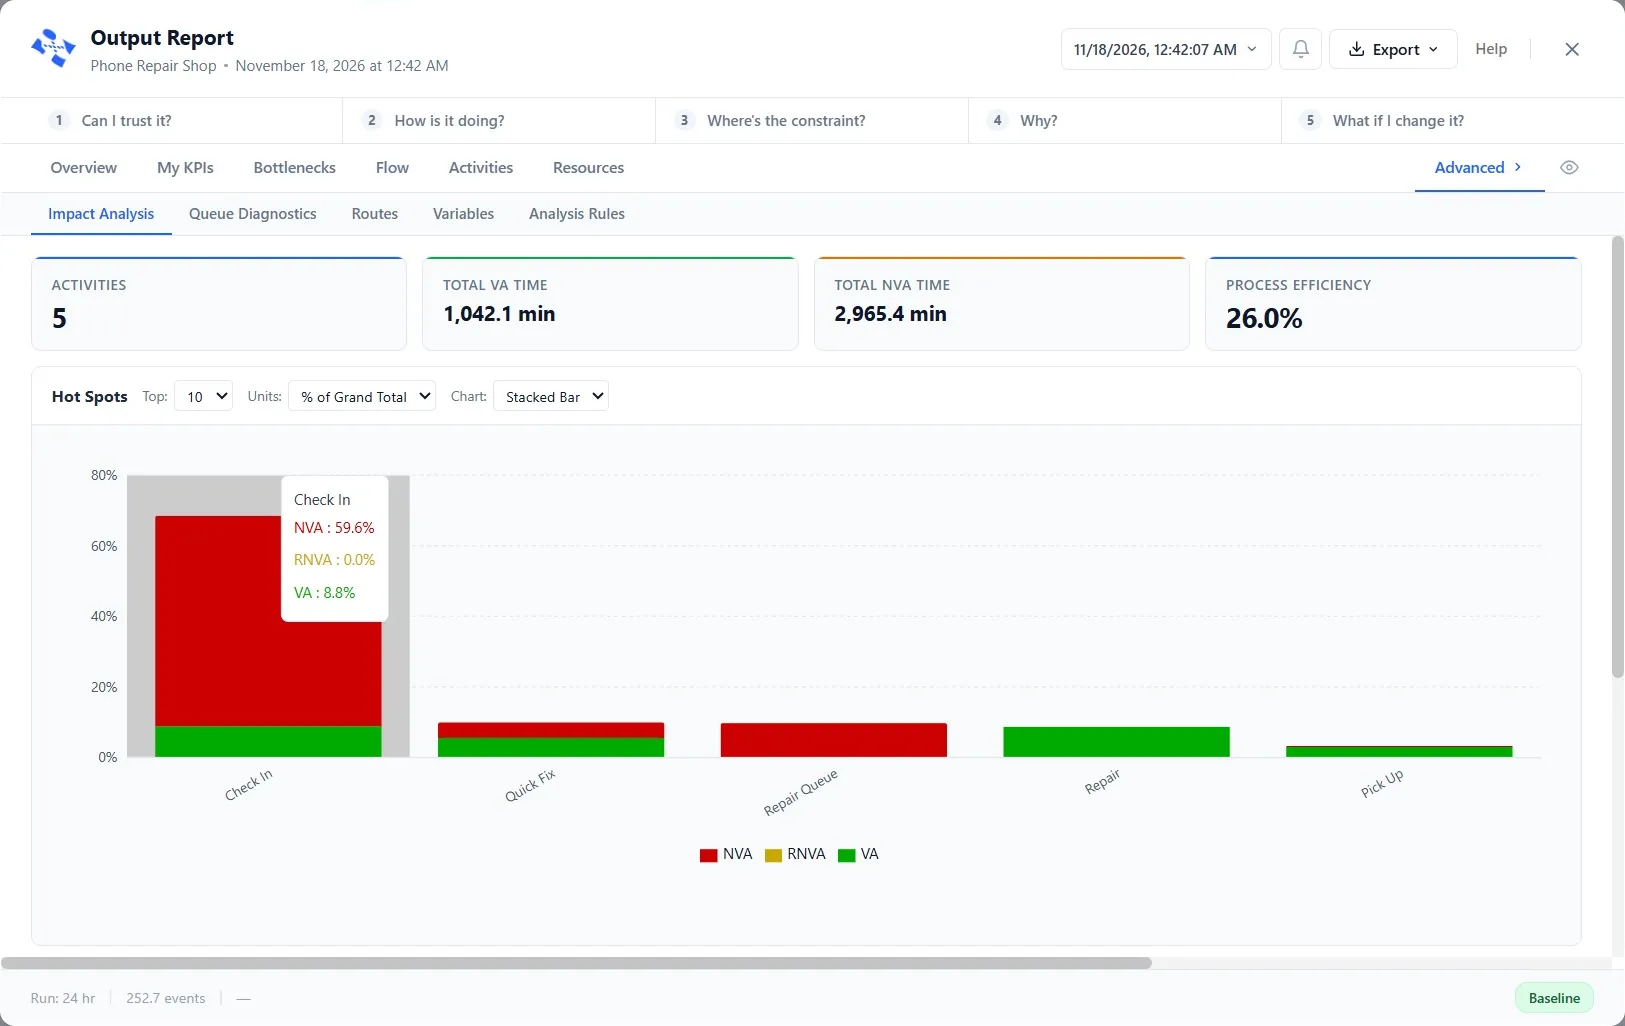
Each bar splits a step’s time into value-added work (green) and non-value-added waiting (red). Check In’s bar is nearly all red. This is the picture to show a manager: it makes the waste visible at a glance.
Step 4. Make the report your own: My KPIs
- Click My KPIs.
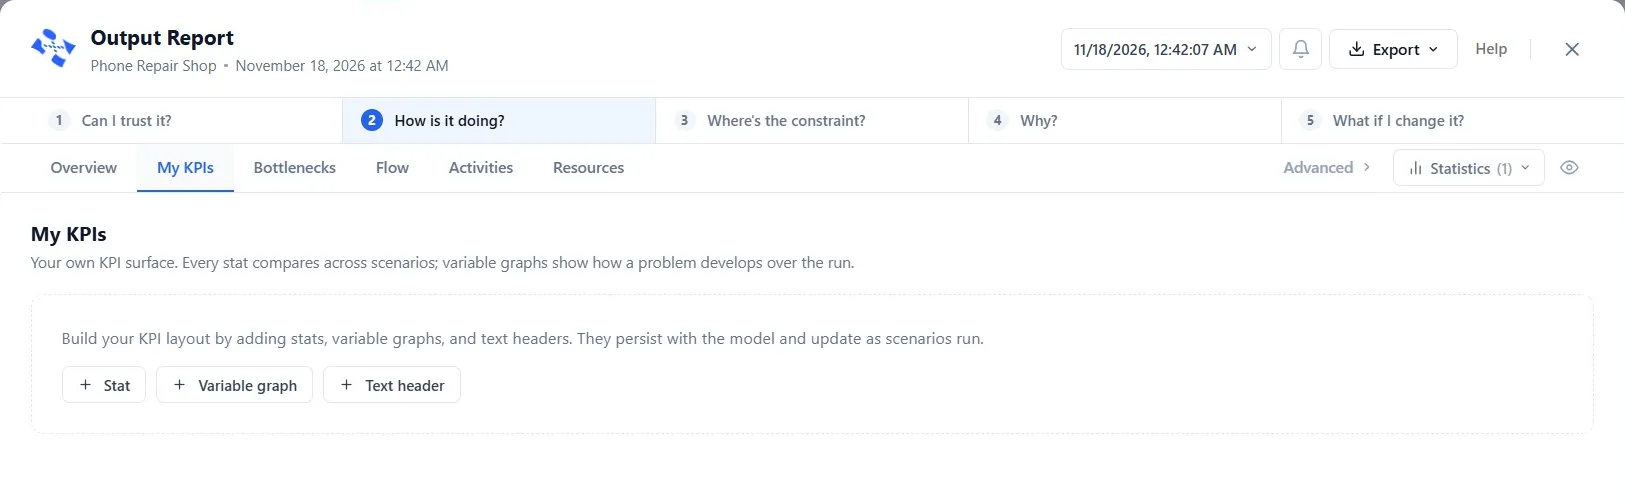
This page starts empty. It is yours: add stats, graphs of variables and headers, and they are saved with the model, so the same page is waiting every time you run it. In a real project, this is where you put the three or four numbers your manager cares about.
Step 5. When does the line build? Bottlenecks
- Click Bottlenecks.
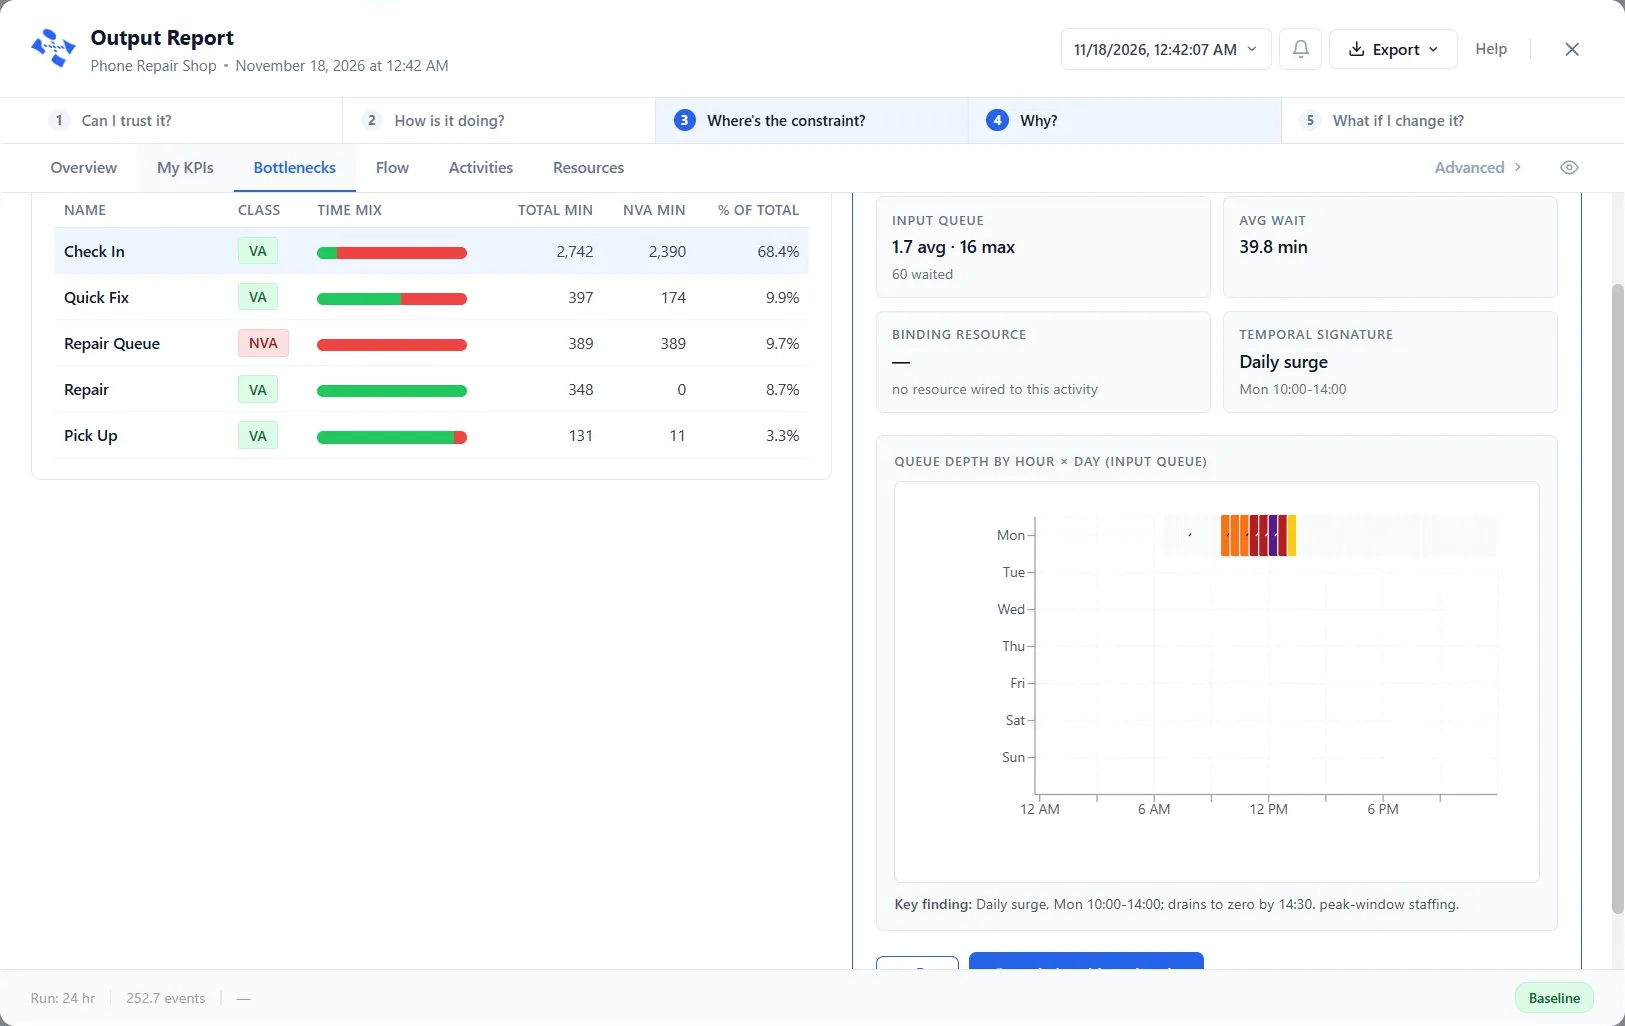
Check In comes first. Its chart shows the line by hour: empty all morning, building from 10, when the office group of twelve arrives, and gone by about half past 2.
Now the cause begins to show. The line is not there all day. It is a surge, and it starts at the moment twelve customers arrive at once.
Step 6. Who waits longest? Flow
- Click Flow.
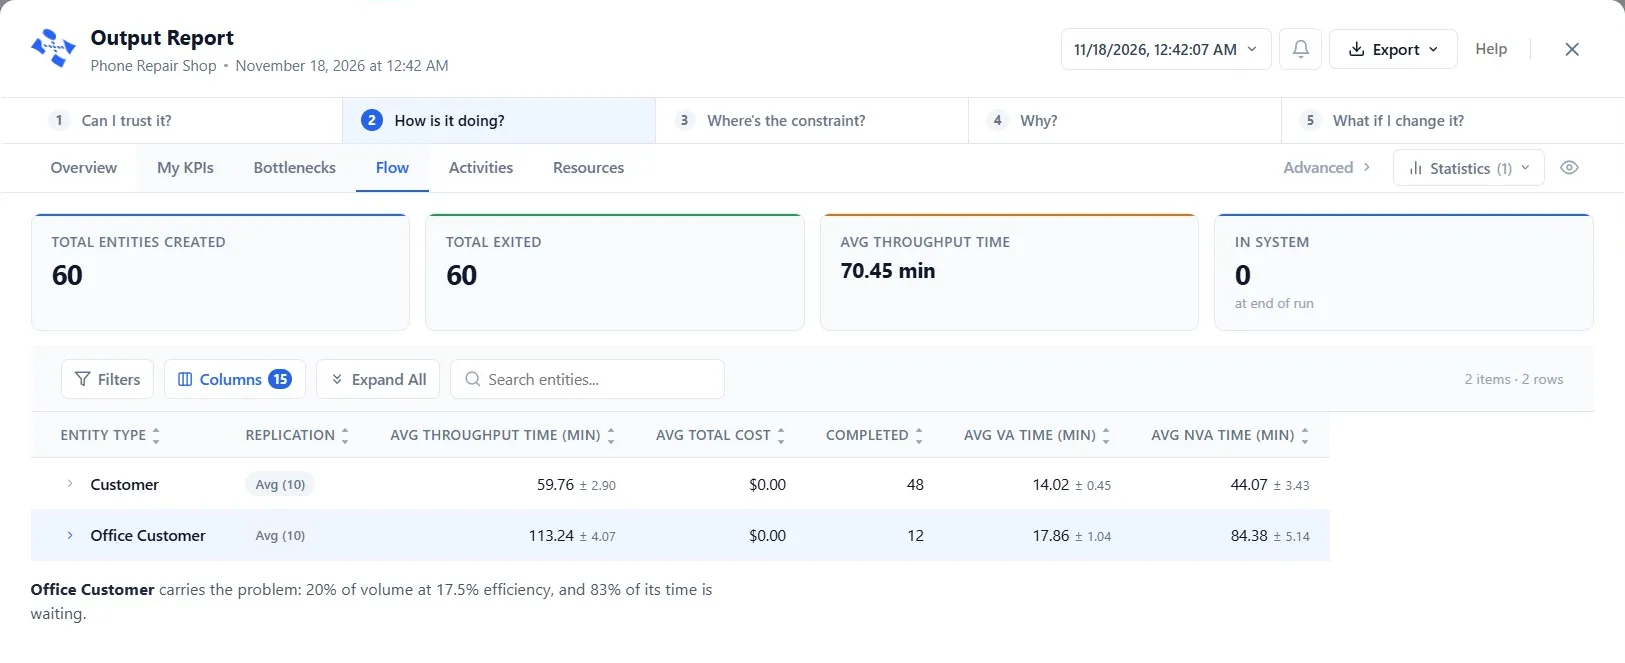
One row for each kind of customer. A walk-in spends about an hour in the shop. An office customer spends nearly two, and most of it waiting. The office group is a fifth of the customers but carries most of the problem.
Step 7. Why? Activities
- Click Activities.
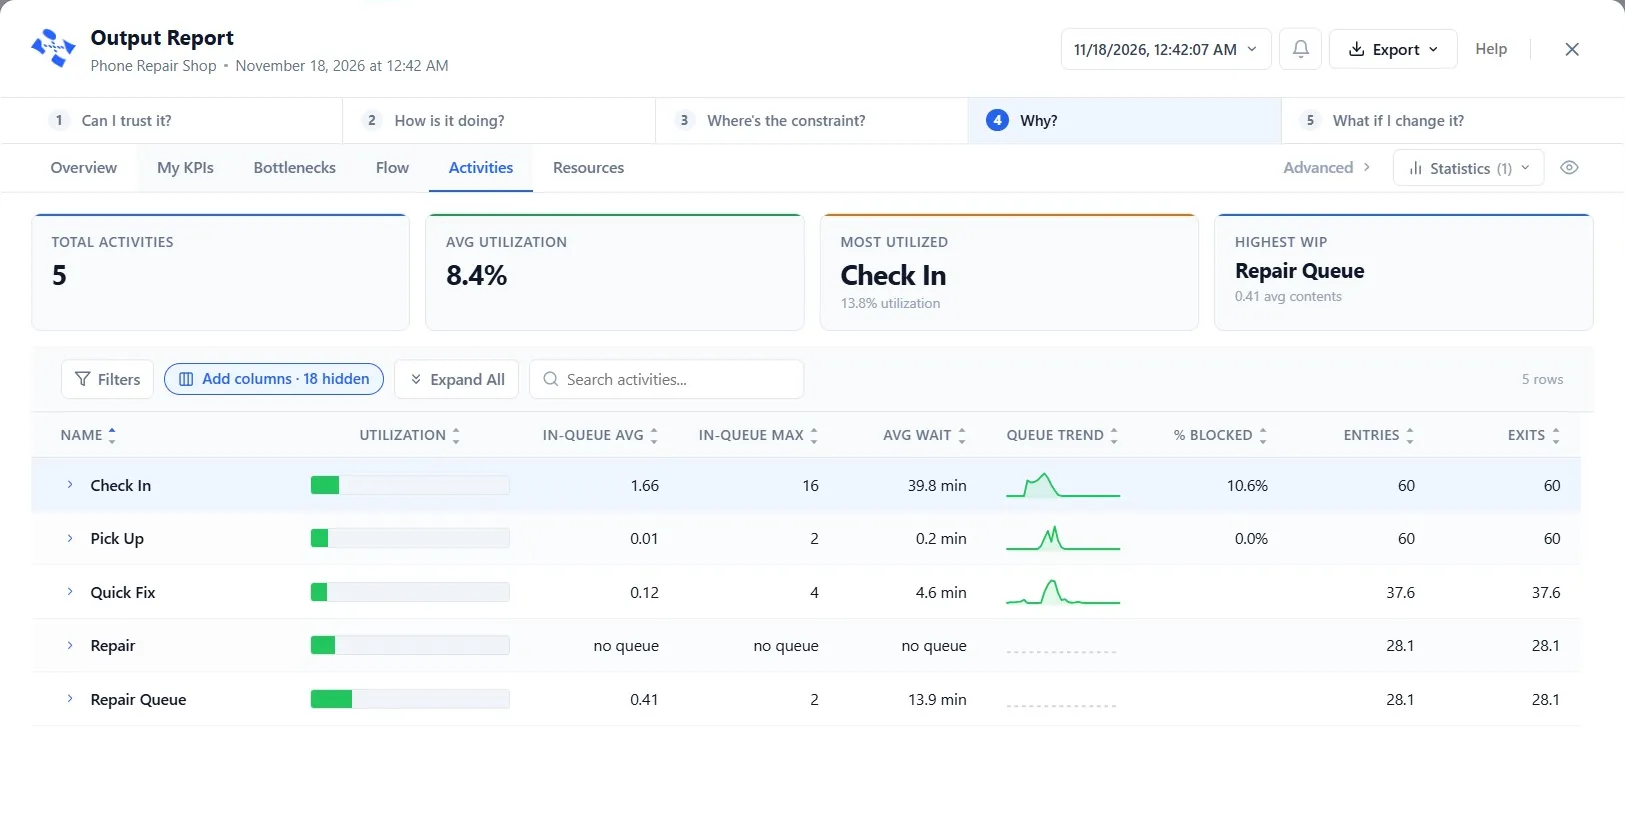
Here is the why. Check In is busy only 13.8% of the time: it is not overworked. But it is blocked 10.6% of the time: it holds a customer it cannot pass on. You met blocking in Chapter 6: when the Repair Queue is full, the customer at Check In has nowhere to go, so Check In stops. And in Chapter 9 you saw what fills the Repair Queue: customers waiting for parts.
Put the clues together, the way the report laid them out:
- The line is at Check In, but Check In is not slow.
- It builds when the office group arrives, and office customers go straight to the Repair Queue.
- Check In is blocked: the Repair Queue behind it is full.
- The Repair Queue fills when the parts run out.
The wait shows up at the front door, but its cause is at the back: the parts supply. That is why reading the report in order matters. Each tab moves you one step from the symptom to the cause.
Step 8. The Technicians: Resources
- Click Resources.
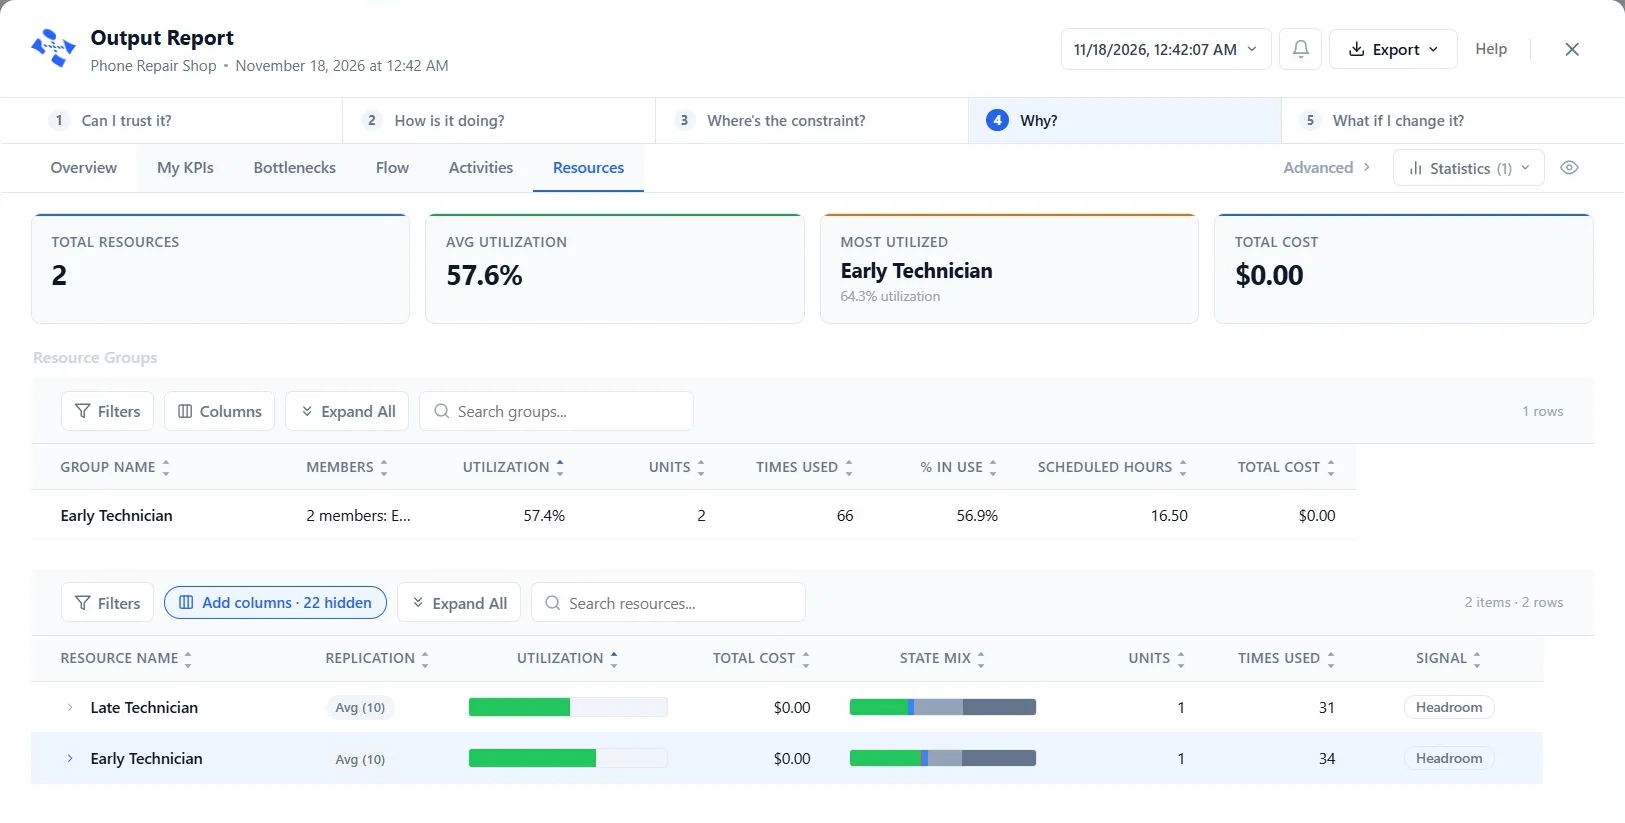
The two Technicians work as one group, and both show Headroom: they have time to spare. So hiring a third Technician is not the obvious fix it might seem. Keep that in mind for Chapter 12.
- Close the report. The last question, What if I change it?, is Chapter 12.
Nothing in the model changed, so there is nothing to save.
Your practice model
- Start fromChapter 10. Run the Day Ten Times, Not OnceThe shop as Chapter 10 left it. Use your own saved Phone Repair Shop instead if you built it.
- Compare withChapter 11. Find Where Your Customers Really WaitThe shop as this chapter leaves it. Open it when you are done, and check your settings against it.
Both are in File ▸ Demo Models, in the Self Teach Guide group. A demo model opens as a new model, so the original never changes.
Check yourself
Try it yourself
Find the cause from the other end: start at the parts.
- Run the ten Mondays again and open the report.
- Click Activities and find the Repair Queue row. Read its average wait and its maximum line.
- Compare them with what this chapter found at Check In.
Mark it done
When you can trace the wait at Check In back to its cause, turn on Done.
You watched this chapter's video.Not watched yet: the video is marked when it plays to the end.
Kept in this browser only, and shown on the course page.