One customer asked, “Could a resource to be underutilized and still be a bottleneck?” The person standing next to him answered, incorrectly, “I don’t think that’s possible.” It is entirely possible for an underutilized resource to be the source of delay, and you can find out exactly when it happens and whether the pattern repeats. Read on to see how to uncover the hidden waste of waiting for a resource.
A utilization graph shows the average of how busy a resource is across its scheduled time.
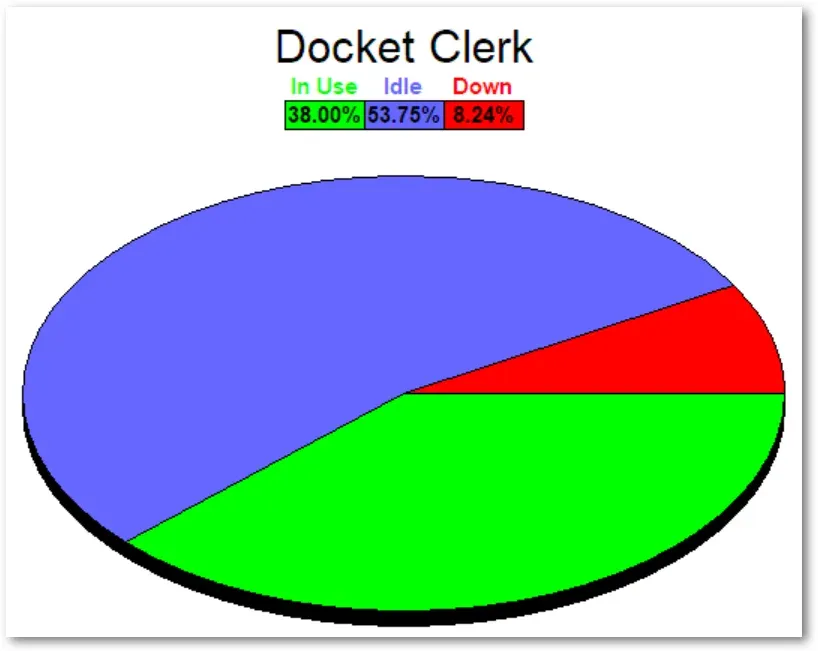
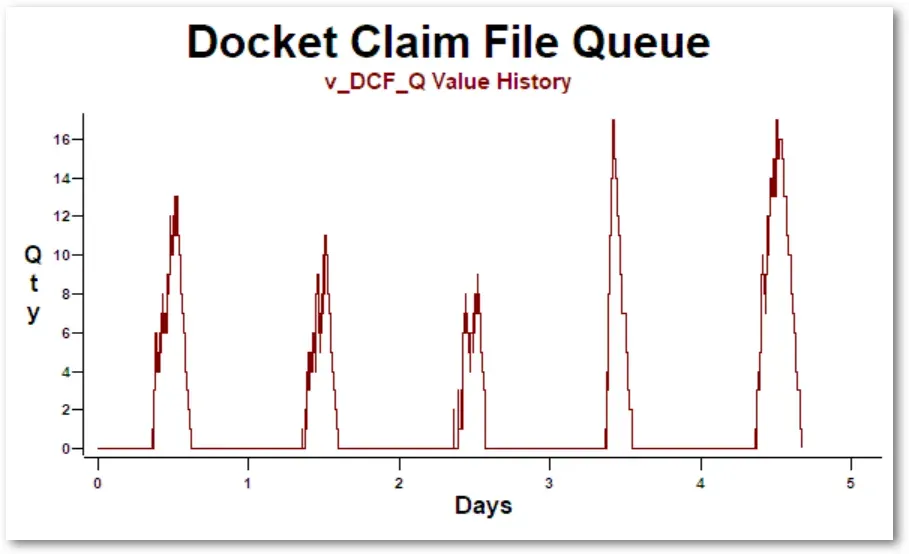
What the graph does not tell you is whether that utilization is spread evenly or packed into a few hours, and whether it follows a recurring pattern. A resource might be swamped every morning and idle the rest of the day, or hammered on Mondays and Fridays with little to do Tuesday through Thursday. When you are making improvements, knowing when a resource causes delays is critical.
This level of analysis is fairly easy to implement when a single resource is attached to a single activity.
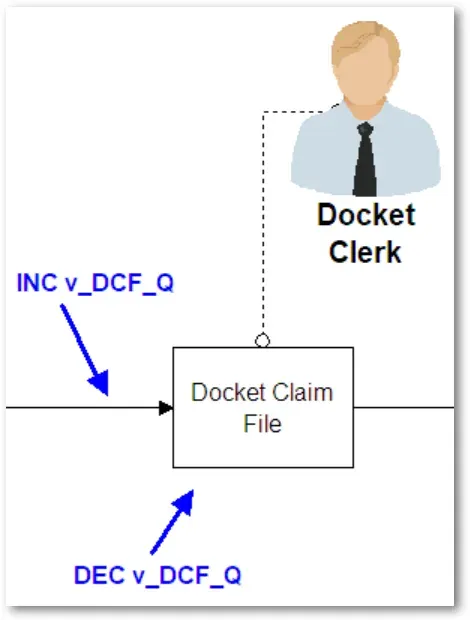
A variable can monitor the queue ahead of the activity. Set it up by incrementing the variable on the route into the activity (the one with an input queue) and decrementing the same variable at the start of the action logic. After the run, plot the variable to see the waiting.
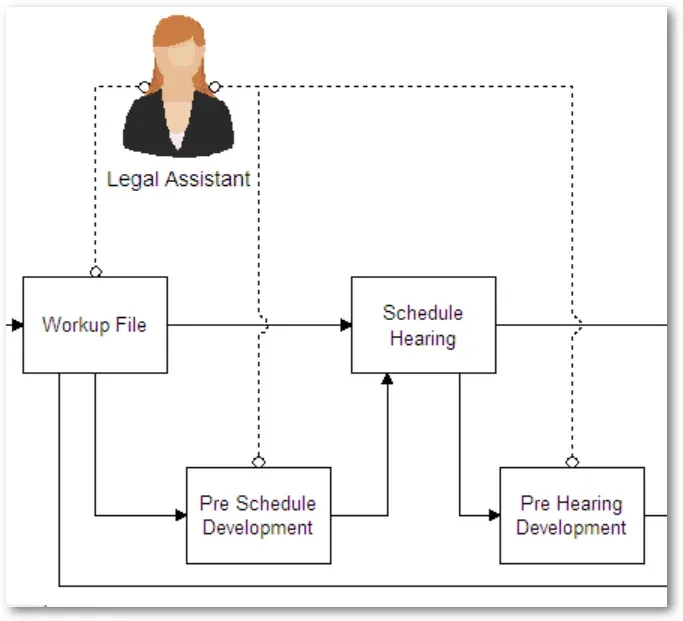
But what about a resource group assigned to many activities, or assigned to entities conditionally? How would you find whether and when that group is a bottleneck, and whether the pattern repeats?
Resource bottleneck mapping
The Resource Bottleneck Mapping model object shows precisely when a resource is the cause of backups. Each half-hour reports the percentage of time the resource group could be the bottleneck, and the result is summarized by day of the week to reveal any weekly pattern.
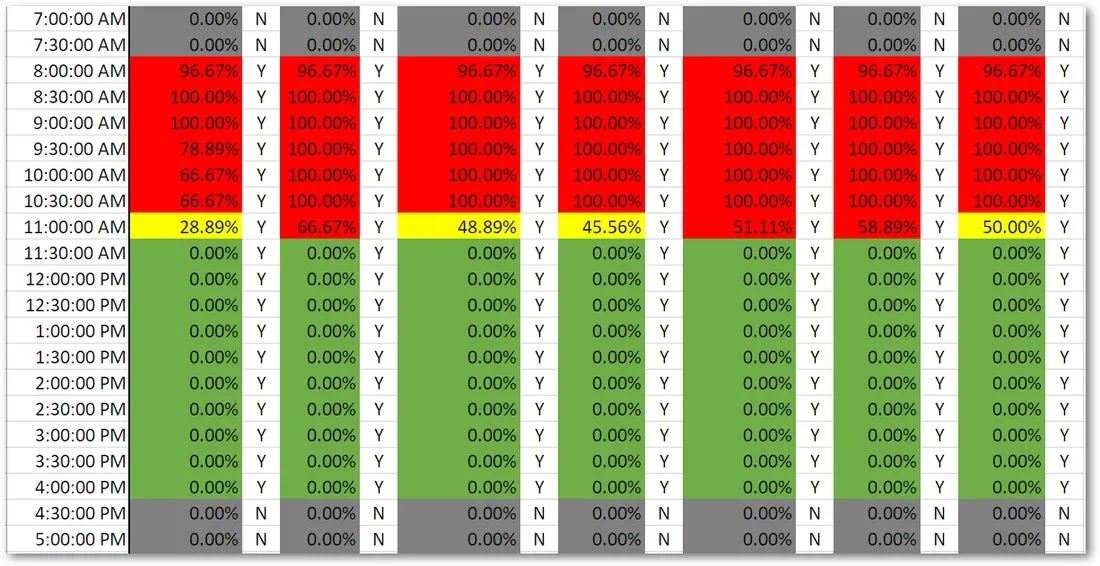
This graph shows a resource group that is overworked in the morning and has no work in the afternoon.
A cell painted red marks time when every resource in the group was busy. The full length of the simulation is analyzed, so recurring patterns and problems stand out. That maxing out of the resources causes waiting at one or more of the queues the group serves. Standard graphs make it hard to see when a group is saturated, but this view makes the trouble spots obvious.
The Resource Bottleneck Mapping model object gives you the detail to find resource problems in seconds. It takes less than a minute to add and pinpoints exactly where resource bottlenecking occurs. Best of all, every model object is included with your maintenance and support. For a deeper look at finding constraints, see our job shop bottleneck analysis, or explore the product.