News and updates

Software testing optimization

Balancing the resources on a software testing line is a multi-dimensional problem you can only guess at without simulation. This worked example shows how to model it, optimize it for cost and time, and drive it with your own data.

A process model of a software testing operation built for optimization in ProcessModel

Balancing the resources for a software testing process can be overwhelming. Software components vary in complexity, so they need different processing times. The skill level of each resource shifts those times again. The order in which components are scheduled adds another layer, and rework loops make it harder still. This is a multi-dimensional problem that you can only guess at without simulation. The real question to answer is this: what balance of resources minimizes our cost and shortens our delivery time?

What follows is one example of how simulation and modeling apply to software development and testing. The same techniques carry over to many other software activities.

How to find the software testing model

Before going further, download the Software Testing example model. It needs ProcessModel to open and run, so make sure ProcessModel is installed first. If you do not have it yet, request a trial. Once the model is downloaded, open it in ProcessModel and start reviewing how it is built.

How the model was built

Most of the objects in the model are color-coded:

  • All the activities are light yellow.
  • All the resources are colored and numbered.
  • The squares on the light blue, green, or red background are highlighted text that describes specific paths.
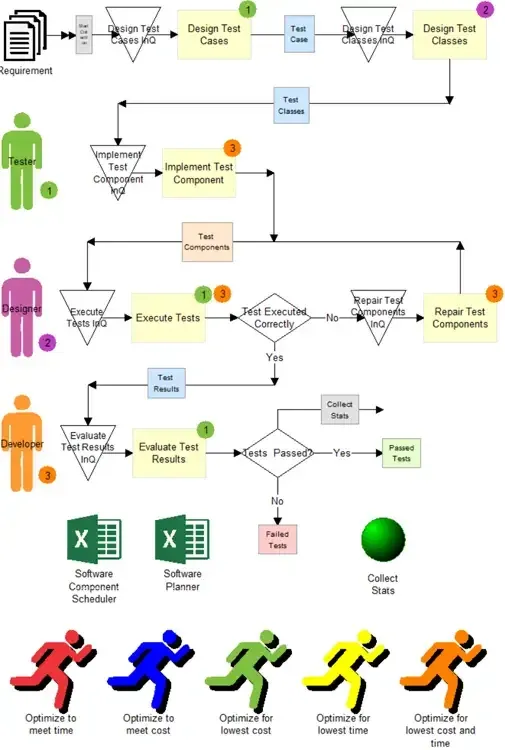
  • The objects at the bottom of the model, drawn as people running, attach the optimization files used later.

The color-coded software testing model in ProcessModel

A few details are worth understanding before you run anything:

  • Each activity has a separate input queue in front of it. To anyone familiar with ProcessModel this looks odd, since the input queue is normally defined inside the activity. Here it is separated so that action logic in the input queue can capture resources using the spreadsheet files. With the queue built into the activity, that logic would not be possible. The input queue inside each activity is set to zero.
  • Every activity has zero in the time field. All the times are applied through action logic using attribute values that arrive with the entities.
  • Software components enter the model through a scheduled arrival. Open it and you can review every arrival and its action logic. The attributes supply the processing time at each station.
  • Two spreadsheet icons attach the two files used to prepare and import your data into the model.
  • The three resources on the left each have a scenario parameter set as their quantity, such as p_NumbTester and p_NumbDesigner. Scenario parameters are how you change the number of resources during experimentation.

Open the Attributes, Variables and Scenarios window to see how these are organized. The entity attributes include a_TimeIN, which records when a component enters the input queue; a_Time_Act-Name, which holds the processing time for each entity at the named activity (defined in the scheduled arrivals); and a_ErrorRate_Act-Name, which records potential errors on that component. The variables include v_EntCheck#, an internal variable that controls resource selection, and v_Act-Name_TimeInQ, which stores how long components have waited in each input queue. The scenario parameters include p_NumbRes-Name for the number of resources available in an experiment and p_CostPerRes-NameHr for the hourly cost of each resource type.

The Attributes, Variables and Scenarios window for the model

There is action logic in both the input queues and the activities. Because we drive the model with the spreadsheet files, you do not have to write or change any of it.

At this point it helps to walk the basic flow. A software component arrives and goes to the input queue of Design Test Cases, where it waits for a resource. Once a resource is captured, the component moves into the activity, takes its processing time, then moves on to the input queue of Design Test Classes, and so on down the line.

Model simulation and output report

With a feel for how the model flows, simulate it and view the output report.

Click Simulate to start.

Starting the simulation from the toolbar

A new window opens with the components animated as they move. Spend a little time watching where components get stuck.

The simulation window with components moving through the line

When the simulation ends, decline the old output report, then click the Output Report icon on the toolbar.

Opening the output report after the run

In the report you can review resource utilization, total system cost, and the number of components approved.

The output report showing utilization, cost, and components approved

Model optimization

Now try optimizing the model. As mentioned, the running-people objects at the end of the model attach the optimization files already created for it. There are five of them. Work through one example here and the rest will be easy to follow.

Optimize for lowest cost and time

For optimization we use SimRunner, the optimization tool built for ProcessModel. The model must be simulated first, then open SimRunner immediately.

Open SimRunner, then open the project. Browse to the folder where the Software Testing model is saved, locate the file named Opt for lowest cost_Time.opt, and open it.

Opening the optimization project in SimRunner

Click Define objectives on the left and review the response statistics chosen for the objective function. Here we minimize the number of resources, the total system cost, and the project duration.

Reviewing the optimization objectives

Note that v_TotalHours carries an objective weight of 100. To make hours significant alongside total cost, we added a weighting factor of 100.

Click Define inputs and review the macros chosen as input factors. These are the scenario parameters described earlier, which let SimRunner adjust how many resources are assigned. In this example the number of testers can run from a low of two to a high of six, starting at four, while developers and designers range from two to six, starting at three. The default value is where the search begins.

Defining the input factors for the optimization

Click Optimize Model, then Seek optimum, then Run. Each experiment runs with ten replications, and experiments are compared by the objective function so the strongest rise to the top.

Seeking the optimum across experiments

From these experiments, the overall cost moves from 12,099.17 to 12,209.104 while the total hours drop from 45.23 to 31.244, using 5 testers, 4 designers, and 5 developers. Review the other optimization experiments the same way by opening a different project.

How to import raw data

You have seen how the model flows, how to read the output report, and how to optimize toward a goal. Now bring in your own project data. Two spreadsheet files handle this: the Software Component Scheduler and the Software Planner.

Software Component Scheduler

Right-click the spreadsheet icon labeled Software Component Scheduler and open the Scheduled Arrivals with Table workbook. It does two things: it lets you schedule the order in which components are processed (high complexity first, low complexity first, intermingled, and so on), and it gives you an easy way to enter the time for each component at each stage, based on complexity.

1. Column A, Time. Enter the start time for each component, for example 11/04/2019 12:01:00 AM. We use a specific date because this model runs continuously without shifts or off-shift time, and the date fixes the exact start of the simulation.

Entering the arrival time in column A

2. Column B, Qty. Add the quantity of components for each complexity level.

Entering the quantity per complexity level

3. Column C, Codes. Here the codes are the complexity levels. You could instead vary timing by other characteristics of the components, but this example uses complexity only.

Entering the complexity codes in column C

4. Copy the time attributes from the model. The easiest way to move attributes from the model into the input sheet is to export the model file, select the Attributes tab, select all the Time attributes, and copy them. Place the cursor in cell D6 of the Schedule Input sheet.

The Attributes tab of the exported model

Pasting the time attributes into the input sheet

Paste using Transpose to switch the attributes from vertical to horizontal.

The attributes pasted in horizontal orientation

5. Go to the worksheet called Table (Time).

Switching to the Table (Time) worksheet

6. Paste the attributes again into column A3.

Pasting the attributes into the Table worksheet

7. Paste your codes into cell C2.

Adding the codes to the Table worksheet

8. Add your base times and your times or distributions per complexity level. The base time is the time used regardless of complexity, such as administrative work done before testing starts. If there is no administrative work, set the base time to zero. Values can be a single integer or a distribution, and they are usually a distribution describing how long an activity takes for a given complexity. In the example, designing test cases is simple for level one, taking twelve to twenty minutes, while a level five takes two to four hours to plan. Change these to match your own system.

Adding base times and distributions per complexity level

9. Go back to the Ent (Software_Component) worksheet.

10. Click Populate Data to fill the columns. This button matters because switching or alternating the order of components, with the correct times for each, can now be done in seconds.

Populating the data into the columns

11. Go back to ProcessModel, export the data, and close the export file. This prepares the data to be read back in.

Exporting the data from ProcessModel

12. The Software TestingData worksheet opens automatically. Close it.

13. Return to the Scheduled Arrivals with Table workbook and click Update to import the new data into ProcessModel. Close all dialogs in ProcessModel before you click Update.

Updating the model with the new scheduled arrival data

Software Planner

The Software Planner allows quick reassignment of resources and lets you set priorities when a resource has multiple responsibilities. When information on this sheet changes, the model updates automatically. Right-click the spreadsheet icon labeled Software Planner and open the Software Planner workbook. From here you can define times, error rates, skills, and resource assignments. The first four sheets are for setup, and the fifth can be changed on an ongoing basis.

1. This model simulates uninterrupted hours, so the Shifts worksheet needs few changes. On a first use, click Setup Workbook.

2. Time Definition. Define the skill levels each resource type (developer, designer, tester) can have. Here the resources are numbered: one is a tester, two is a designer, three is a developer. Then define the time multipliers. In this example, a resource with skill level three takes 40% less time (0.6 times the time defined in the attribute) than a skill level one person for designing test cases. Adjust the multipliers to your needs. You could even give developers different skill levels so your most accomplished people focus on the hardest problems first. This example keeps three skill levels.

Defining skill levels and time multipliers

3. Error Rate. Define the percent error expected from each resource skill type at each activity. Here a skill level three person has a 1% error rate on designing test cases.

Defining the error rate per skill level and activity

4. Skills Portfolio. Define the skill level of each resource for every activity. At Design Test Cases, for example, every skill level is capable of the job.

Defining the skills portfolio for each resource

5. Resource Assignment. Use the color-coding to see which resource has which skill for which activity, then assign resources to an activity with a priority number. A tester might work on Designing Test Cases, Execute Tests, and Evaluate Test Results, with designing test cases as the priority. The higher the number, the higher the priority.

Assigning resources to activities by priority

To assign all resources to Design Test Cases, enter a priority in cells C7 and C8. Under that scenario the tester is the first choice, the developer the second, and the designer the third.

Updating a resource assignment in the planner

6. Click Import Information to ProcessModel to push all the changes into your model. Close all dialogs in ProcessModel first. This matters because changing resource assignments by hand gets difficult once many other factors are in play. Here the changes are automated and applied in seconds.

This model and approach apply to many software testing and development scenarios. Adding activities, renaming them, or starting a new model from scratch is easily done with the two spreadsheet files in minutes.

You can probably think of changes worth trying to cut the time and cost of the work. Could higher-skilled workers help in lower-skilled areas when they are idle? What about mixing the schedule of complexity levels, say one difficult, two hard, four medium, then repeating the pattern? Each change takes only minutes to prepare and test.

For more on finding and clearing the constraints in a process like this, read about job shop bottleneck analysis, or see how ProcessModel and SimRunner optimize a line.

See your process clearly, then prove the fix

Build the model, run the simulation, find the constraint, and show the improvement before you change a thing.