
A factory that wanted to know its output next quarter stopped guessing about thirty years ago. It built a model, ran it, and read the answer with a confidence interval attached.
Software teams, meanwhile, are still adding up story points and hoping. Which is strange, because a delivery team is a process like any other. Work arrives, it queues, somebody works on it, it gets checked, sometimes it comes back, and eventually it ships. That is a production line with a different vocabulary.
ProcessModel now models it in that vocabulary, and answers the question everyone actually asks: when will this be done, and how sure are you?
Start from a written plan of work
The genuinely new piece is the Work Table. Before you run anything, you write down the plan: what has to be built, what type each item is, which release it belongs to, and what it depends on.
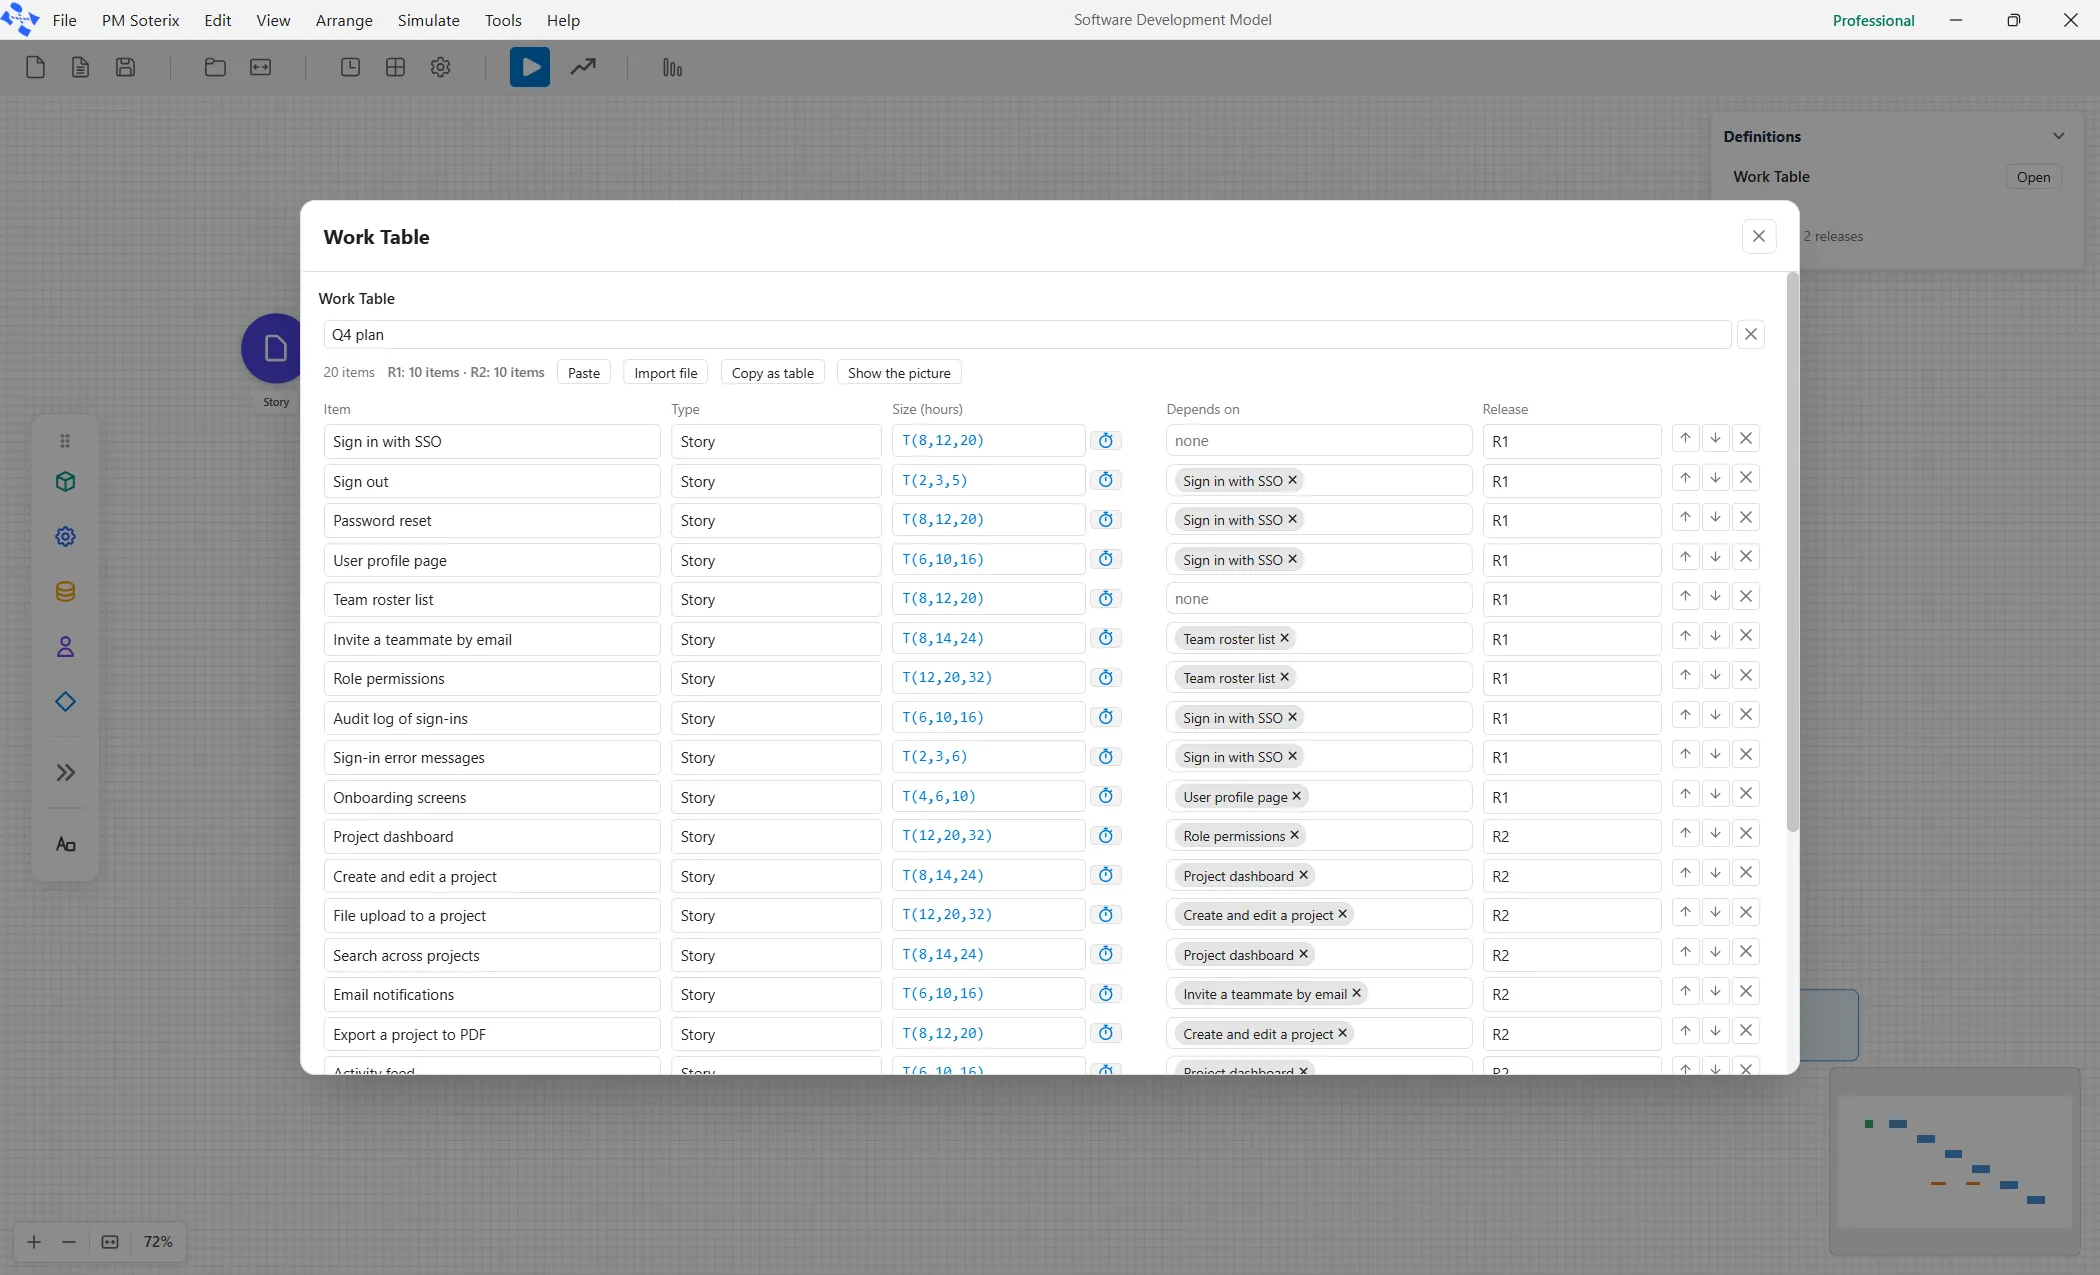
That single table is what separates this from a burndown chart. The model knows that item fourteen cannot start until item nine is done, so when item nine slips, everything behind it moves and you can see exactly how far.
Around the plan you place the rest: a Team with real people in it, a Backlog where work waits, Steps that each carry a kind, Review and Test for the checking, a Pipeline, a Release, a Freeze, and Done. On the Software palette, one button builds a small complete model of all of it so you can see the pieces fit before you build your own.
A forecast, not a date
Run it and the report opens on Forecast, and this is where the conversation changes.
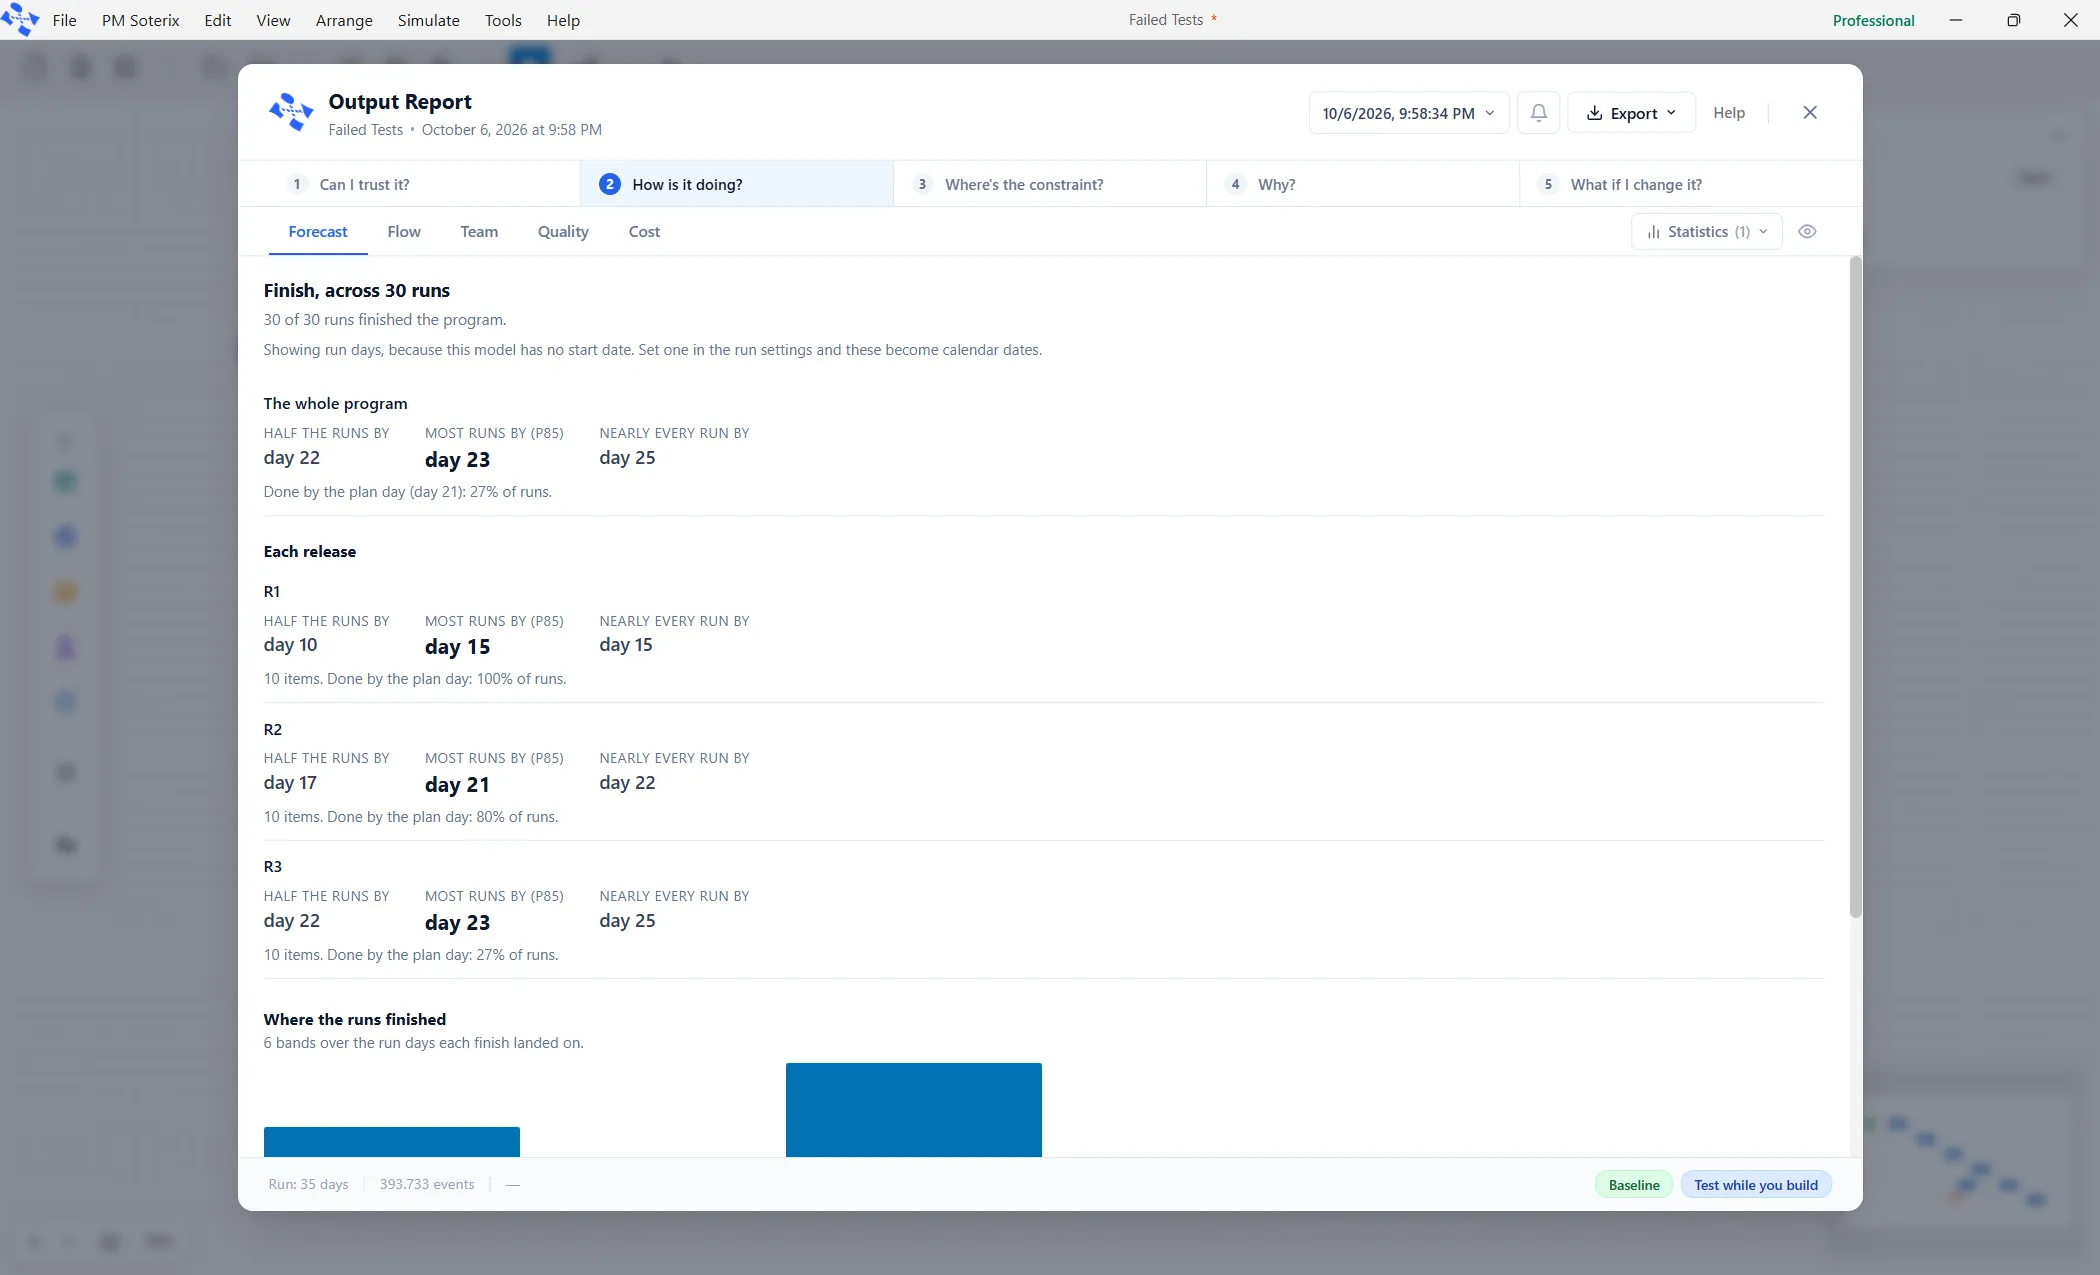
You do not get a date. You get three: the day half the runs finished by, the day most runs finished by, and the day nearly every run finished by, for the whole program and for each release. Under them, a chart shows where the runs actually landed.
Promise the middle one. The first reading is the day you beat exactly half the time, which means promising it makes you late half the time, and everybody has met the manager who does not know that. The middle reading is the one you can defend in a steering meeting, because it comes with the spread behind it.
The numbers that start arguments, in a good way
Flow efficiency is on the Flow tab, and it is the share of each item’s elapsed time that anybody was actually working on it. For a real team it typically lands between ten and twenty percent. Teams see that number and immediately want to argue with it, which is the point. Most of an item’s life is spent waiting, and no amount of working harder touches the other eighty percent.
Blocked, per item lists what waited and for how long. A large blocked figure is not a slow developer, it is an item waiting on another item, which is a planning problem rather than a capacity problem. The distinction is usually invisible until you model it.
The Team tab reads how busy each team was, and it will cheerfully tell you that hiring is not your answer. The Quality tab counts what was checked, what came back for rework, and what was dropped from the plan entirely. The Cost tab appears as soon as a team carries an hourly rate, and puts a number on all of it.
Then ask the better question
Once the model reflects your team, the interesting work starts. What if two more people join in week six? What if we cut the review step? What if we ship the release in two halves?
Each of those is a scenario, and when you want the best combination rather than one guess at a time, PM Optimizer searches for it and ranks what it finds. That is the part a spreadsheet was never going to do.
Where to read more
Software development modeling introduces the ten elements, the Work Table covers the plan of work in full, and the software delivery report explains every tab you will read afterwards. To build one from an empty canvas, the step-by-step guide takes about two hours and its finished model ships inside the product. For the wider picture, see what’s new in ProcessModel 7.