

The problem
Where the time was going
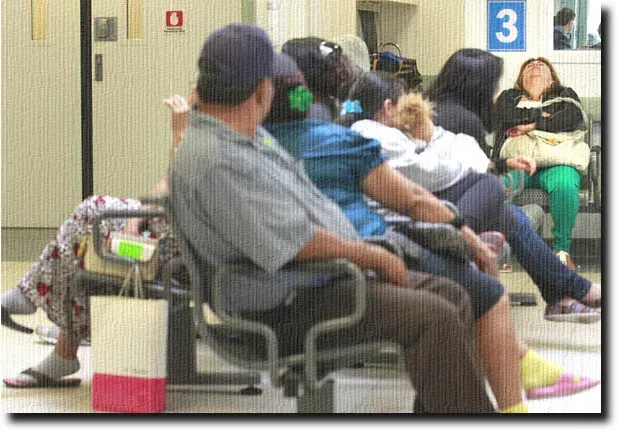
Picture waiting five hours in an emergency department for an urgent but simple problem. During the busy hours it is no exercise of imagination, it is the experience. Nationwide, the average door-to-discharge time runs about 136 minutes, and that figure is flattered by quiet rural departments and quiet hours like three in the morning.
This department was well above the national average, with a door-to-discharge time of 193 minutes, nearly fifty percent higher, and many patients living the dreaded five-hour stay. When the team interviewed each type of resource in the department, every group pointed at another as the cause. Nurses felt doctors were slow to decide, doctors blamed interruptions from nurses, triage blamed the lab, and the lab blamed mistakes that slowed it down.
The department was genuinely hard to read. Patient arrival rates change all day, each resource type changes in number throughout the day in ways that may not line up with arrivals, and response times from supporting departments shift by the hour. Each acuity level carries different service requirements and even a different process flow, and that flow changes by time of day too.
What we modeled
Mapping the process, then testing the fix
Solving this by traditional methods looked impossible, so the team built a computer model of the department from system-collected data, time studies, and interviews. The work was broken into six interrelated parts: patient arrivals, the flow describing patient movement, the rules for choosing the next patient, staffing, the distributions describing the time for each step, and an interface for quick changes from a single page.
A full year of system data fed the arrival patterns, acuity breakouts, and lab and radiology requirements, with distributions standing in for the variability of real times so the model behaved with the randomness the real department would see. Four metrics were used to check accuracy against the actual department: average door to doc, average door to discharge, average door to transport, and average patients in the waiting room.
On 30 replications, the model matched the real department on three of those four metrics with greater than 95 percent accuracy, with the waiting-room count at 91 percent and deemed acceptable. That accuracy gave the team confidence that a change tried in the model would behave the same way on the floor.
The result
The proof, and the payoff
The model's biggest value was showing which changes would matter and which would not. Radiology response time looked like a prime suspect, yet the model showed that even cutting it in half would barely move door-to-discharge time, which let the team focus only on changes that reached the goal. A no-cost change, matching staffing to the pattern of patient need, improved every metric without adding a single resource.
Reaching the ambitious target of a door-to-discharge time under 90 minutes took several modeled changes, including the right number of doctors at peak hours and a fix to a lab handoff the model exposed. Lab statistics reported turnaround under 40 minutes, but the metrics would not reconcile until the team found that samples were being sent before the matching order, and that the lab clocked its process from a later scan rather than from arrival. The department cut its door-to-discharge time by more than half, and the model, built in three weeks, became an argument-free way to make changes that actually helped patients.
- 50%+
- reduction in door-to-discharge time
- 95%+
- model accuracy across 30 replications
- $0
- cost of the staffing change that improved every metric
Part of our work in healthcare.