

The problem
Where the time was going
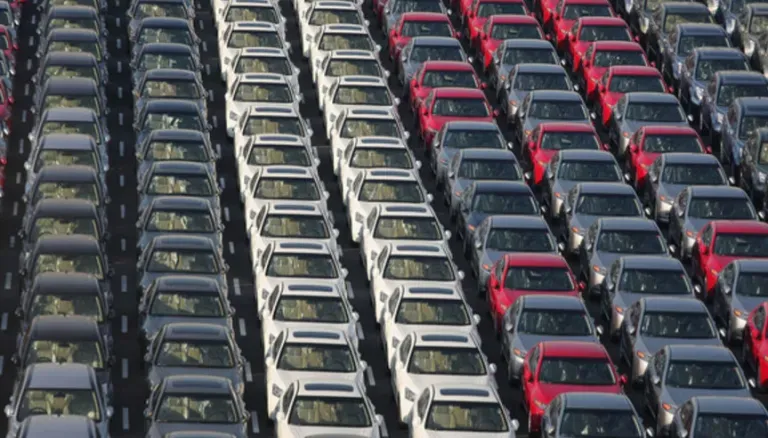
Best-selling models ship overseas by the thousands, and carmakers hand the export details to outside processing centers that prepare each vehicle for its destination. The work is labor intensive, the margins are tight, and a center has to control its processes closely to keep a profit on every car.
What looked like a simple prep line was anything but. Combining vehicle models with the markets they ship to produced more than 500 unique combinations, and each one carried different processing times at every step, since a car takes less time to undercoat than a truck and every model differs. There were also subtle rules about which resources could pause mid-task and which had to finish first, such as an undercoating step that cannot stop partway.
On top of that variability, the center had to find the right staffing to reach maximum throughput on a single shift, a calculation no spreadsheet could make cleanly when every step takes a variable amount of time. The team set out to answer three questions: what it would take to raise production 20 percent on the current shift, how much overtime the same gain would cost with no other changes, and where the real bottlenecks were.
What we modeled
Mapping the process, then testing the fix
ProcessModel mapped the full export operation, using attributes to carry the processing time for each step so the more than 500 model and market combinations could be represented cleanly. Each combination lived as a row of attributes on a back sheet, and scheduling a specific car was a matter of copying its row into the model, which then read in the arrivals and times automatically.
The built-in priority rules captured the real-world detail of which resources could walk away from a task and which had to see it through. A working model was built, tested, and producing initial results in less than two weeks, where another vendor had quoted many weeks of development and a far larger price tag.
With the model in hand, the team could finally see what was causing the existing bottlenecks, and test moving work elements between stations to see how throughput would respond before changing anything on the real lot.
Two months ago I would not have thought an increase of 50% was possible. With what we have learned from the simulation, I am now confident we can achieve this goal and more.
The result
The proof, and the payoff
A simple reallocation of resources, costing almost nothing, raised production by 19 percent on the highest-volume products, and by as much as 37 percent on others. The team had believed the line was already well balanced, so the gain was a genuine surprise, and the real lot behaved exactly as the model had predicted.
The result reset the team's sense of what was possible. Management raised the improvement goal from 20 percent to 50 percent, and the model remained in use to optimize resources against any schedule entered, readjusting staffing across every step to maximize cars per day, with a full optimization run taking only a couple of minutes.
Part of our work in manufacturing.